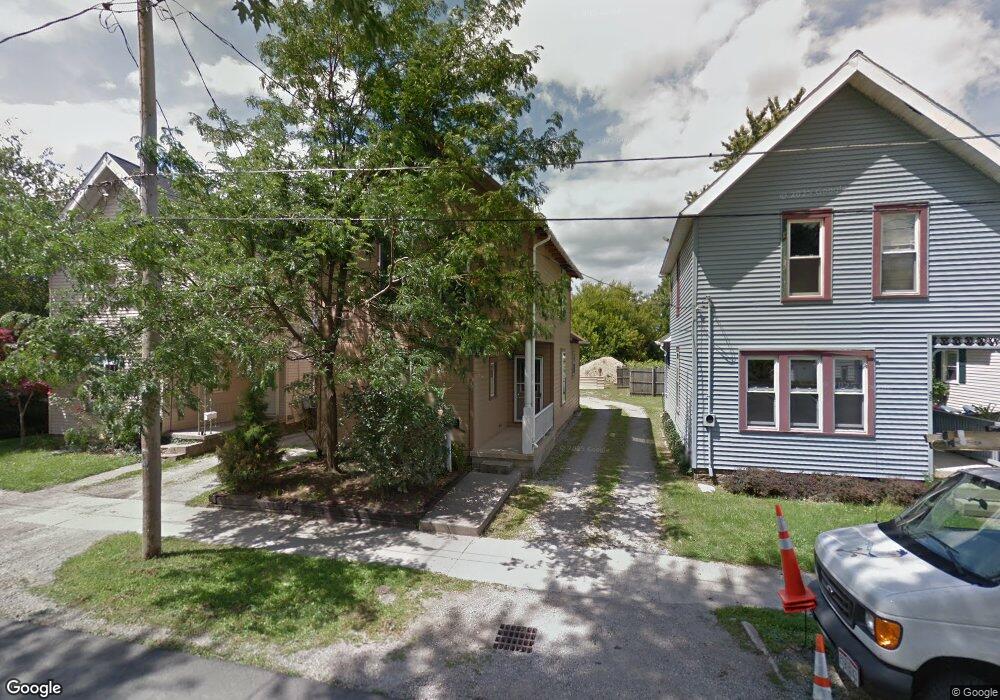
40 Jefferson St Norwalk, OH 44857
Estimated Value: $115,000 - $148,000
3
Beds
1
Bath
1,180
Sq Ft
$107/Sq Ft
Est. Value
About This Home
This home is located at 40 Jefferson St, Norwalk, OH 44857 and is currently estimated at $126,845, approximately $107 per square foot. 40 Jefferson St is a home located in Huron County with nearby schools including Maplehurst Elementary School, Pleasant Elementary School, and League Elementary School.
Ownership History
Date
Name
Owned For
Owner Type
Purchase Details
Closed on
Sep 6, 2022
Sold by
Basil Tamara and Lee C Cox Revocable Trust
Bought by
Sykes Kenneth E
Current Estimated Value
Purchase Details
Closed on
Mar 1, 2021
Bought by
Basel Tamara Successor Trustee
Purchase Details
Closed on
Dec 1, 2020
Sold by
Cox Lee C
Bought by
Sykes Kenneth E
Home Financials for this Owner
Home Financials are based on the most recent Mortgage that was taken out on this home.
Original Mortgage
$34,500
Interest Rate
2.7%
Mortgage Type
Land Contract Argmt. Of Sale
Purchase Details
Closed on
Apr 13, 2020
Sold by
Estate Of Linda Darlene Cox
Bought by
Cox Lee C
Purchase Details
Closed on
Sep 30, 1999
Sold by
Minniear Donald E
Bought by
Smith Linda D
Purchase Details
Closed on
Nov 22, 1996
Sold by
Smith Norbert A
Bought by
Minniear Donald E and Minniear Kelly
Purchase Details
Closed on
Jul 12, 1985
Bought by
Smith Norbert A
Create a Home Valuation Report for This Property
The Home Valuation Report is an in-depth analysis detailing your home's value as well as a comparison with similar homes in the area
Home Values in the Area
Average Home Value in this Area
Purchase History
| Date | Buyer | Sale Price | Title Company |
|---|---|---|---|
| Sykes Kenneth E | -- | -- | |
| Basel Tamara Successor Trustee | -- | -- | |
| Sykes Kenneth E | $34,500 | None Available | |
| Cox Lee C | -- | None Available | |
| Smith Linda D | $56,000 | -- | |
| Minniear Donald E | $39,000 | -- | |
| Smith Norbert A | $7,500 | -- |
Source: Public Records
Mortgage History
| Date | Status | Borrower | Loan Amount |
|---|---|---|---|
| Previous Owner | Sykes Kenneth E | $34,500 |
Source: Public Records
Tax History Compared to Growth
Tax History
| Year | Tax Paid | Tax Assessment Tax Assessment Total Assessment is a certain percentage of the fair market value that is determined by local assessors to be the total taxable value of land and additions on the property. | Land | Improvement |
|---|---|---|---|---|
| 2024 | $751 | $18,400 | $3,290 | $15,110 |
| 2023 | $751 | $18,610 | $2,400 | $16,210 |
| 2022 | $750 | $18,610 | $2,400 | $16,210 |
| 2021 | $750 | $18,610 | $2,400 | $16,210 |
| 2020 | $739 | $17,430 | $2,400 | $15,030 |
| 2019 | $723 | $17,430 | $2,400 | $15,030 |
| 2018 | $710 | $17,430 | $2,400 | $15,030 |
| 2017 | $477 | $11,660 | $2,400 | $9,260 |
| 2016 | $468 | $11,660 | $2,400 | $9,260 |
| 2015 | $467 | $11,680 | $2,410 | $9,270 |
| 2014 | $496 | $12,260 | $2,420 | $9,840 |
| 2013 | $431 | $12,260 | $2,420 | $9,840 |
Source: Public Records
Map
Nearby Homes
- 12 Minard Place
- 102 N Pleasant St
- 157 W Main St
- 29 W Seminary St
- 167 Whittlesey Ave
- 15 E Washington St
- 21 Maple St
- 40 Norwood Ave
- 13 Spring St
- 57 Milan Ave
- 123 E Main St
- 253 W Main St
- 29 Corwin St
- 29 Harris Ave
- 58 E Elm St
- 230 Whittlesey Ave Unit 46
- 230 Whittlesey Ave Unit 59
- 230 Whittlesey Ave Unit 72
- 15 W Chestnut St
- 4 Deer Track Trail Unit A
- 38 Jefferson St
- 42 Jefferson St
- 44 Jefferson St
- 36 1/2 Jefferson St
- 36 Jefferson St
- 58 N Pleasant St
- 58 N Pleasant St
- 34 Jefferson St
- 56 N Pleasant St
- 54 N Pleasant St
- 60 N Pleasant St
- 39 Jefferson St
- 37 Jefferson St
- 32 1/2 Jefferson St
- 35 Jefferson St
- 52 N Pleasant St
- 33 Jefferson St
- 31 Jefferson St
- 32 Jefferson St
- 64 N Pleasant St