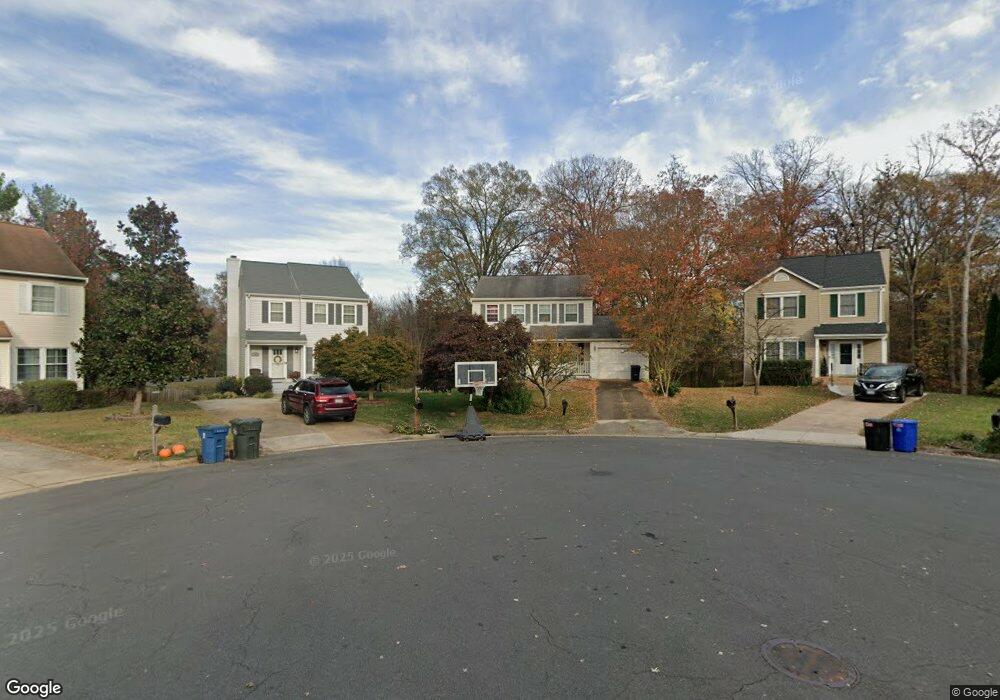
40 Jeremy Ct Sterling, VA 20165
Estimated Value: $721,470 - $728,000
3
Beds
4
Baths
1,760
Sq Ft
$411/Sq Ft
Est. Value
About This Home
This home is located at 40 Jeremy Ct, Sterling, VA 20165 and is currently estimated at $723,618, approximately $411 per square foot. 40 Jeremy Ct is a home located in Loudoun County with nearby schools including Countryside Elementary School, River Bend Middle School, and Potomac Falls High School.
Ownership History
Date
Name
Owned For
Owner Type
Purchase Details
Closed on
Aug 27, 2024
Sold by
Brown Silvia Diane E
Bought by
Brown Silvia Diane E
Current Estimated Value
Purchase Details
Closed on
Jul 13, 1998
Sold by
Tyrrell Joseph F
Bought by
Brown Barbara J
Home Financials for this Owner
Home Financials are based on the most recent Mortgage that was taken out on this home.
Original Mortgage
$195,700
Interest Rate
7.02%
Create a Home Valuation Report for This Property
The Home Valuation Report is an in-depth analysis detailing your home's value as well as a comparison with similar homes in the area
Home Values in the Area
Average Home Value in this Area
Purchase History
| Date | Buyer | Sale Price | Title Company |
|---|---|---|---|
| Brown Silvia Diane E | -- | None Listed On Document | |
| Brown Barbara J | $206,000 | -- |
Source: Public Records
Mortgage History
| Date | Status | Borrower | Loan Amount |
|---|---|---|---|
| Previous Owner | Brown Barbara J | $195,700 |
Source: Public Records
Tax History Compared to Growth
Tax History
| Year | Tax Paid | Tax Assessment Tax Assessment Total Assessment is a certain percentage of the fair market value that is determined by local assessors to be the total taxable value of land and additions on the property. | Land | Improvement |
|---|---|---|---|---|
| 2025 | $5,423 | $673,710 | $237,000 | $436,710 |
| 2024 | $5,643 | $652,420 | $217,000 | $435,420 |
| 2023 | $5,427 | $620,280 | $217,000 | $403,280 |
| 2022 | $5,255 | $590,450 | $207,000 | $383,450 |
| 2021 | $4,885 | $498,500 | $183,500 | $315,000 |
| 2020 | $4,856 | $469,150 | $178,500 | $290,650 |
| 2019 | $4,687 | $448,480 | $178,500 | $269,980 |
| 2018 | $4,666 | $430,010 | $178,500 | $251,510 |
| 2017 | $4,904 | $435,870 | $178,500 | $257,370 |
| 2016 | $4,728 | $412,940 | $0 | $0 |
| 2015 | $4,618 | $228,400 | $0 | $228,400 |
| 2014 | $4,778 | $255,170 | $0 | $255,170 |
Source: Public Records
Map
Nearby Homes