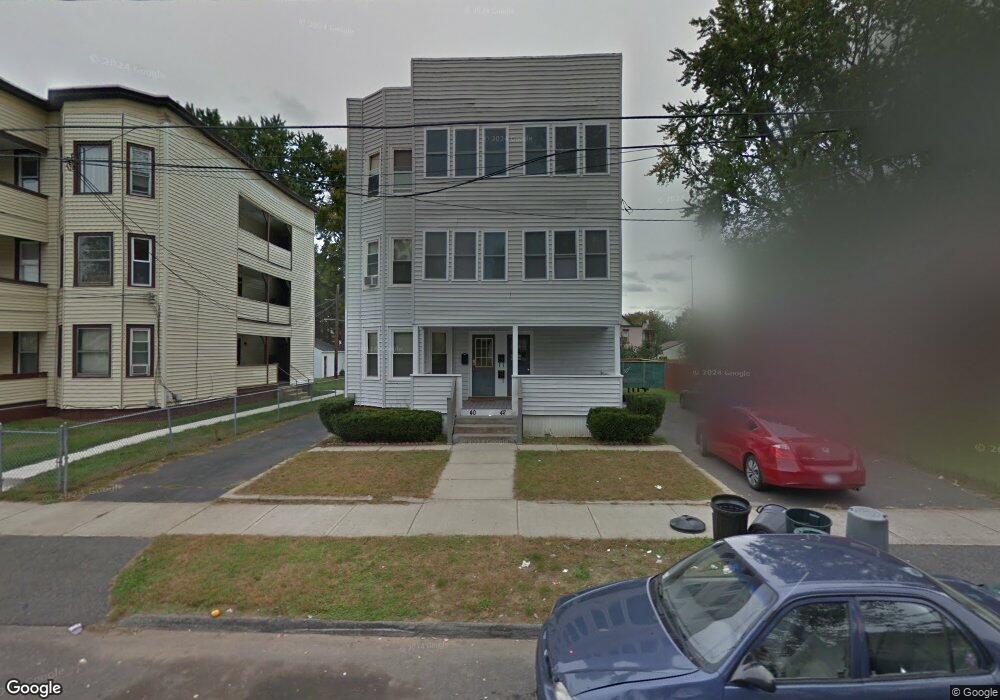
40 John St Chicopee, MA 01013
Willimansett NeighborhoodEstimated Value: $334,000 - $513,000
9
Beds
4
Baths
4,241
Sq Ft
$96/Sq Ft
Est. Value
About This Home
This home is located at 40 John St, Chicopee, MA 01013 and is currently estimated at $406,333, approximately $95 per square foot. 40 John St is a home located in Hampden County with nearby schools including Fairview Elementary School, Bellamy Middle School, and Chicopee Comprehensive High School.
Ownership History
Date
Name
Owned For
Owner Type
Purchase Details
Closed on
Aug 18, 2020
Sold by
Schoolcraft Alexandra P
Bought by
Schoolcraft Realty Llc
Current Estimated Value
Purchase Details
Closed on
Aug 11, 2010
Sold by
Wells Fargo Bk
Bought by
Schoolcraft Alexandra P
Purchase Details
Closed on
Jul 9, 2010
Sold by
Houle David A
Bought by
Wells Fargo Bk
Purchase Details
Closed on
Oct 28, 2008
Sold by
Houle David A
Bought by
Wells Fargo Bk
Purchase Details
Closed on
Aug 27, 1992
Sold by
Lafrenaye Harvey N and Lafrenaye Vivianne
Bought by
Houle David A
Home Financials for this Owner
Home Financials are based on the most recent Mortgage that was taken out on this home.
Original Mortgage
$125,701
Interest Rate
8.09%
Mortgage Type
Purchase Money Mortgage
Create a Home Valuation Report for This Property
The Home Valuation Report is an in-depth analysis detailing your home's value as well as a comparison with similar homes in the area
Home Values in the Area
Average Home Value in this Area
Purchase History
| Date | Buyer | Sale Price | Title Company |
|---|---|---|---|
| Schoolcraft Realty Llc | -- | None Available | |
| Schoolcraft Alexandra P | $110,100 | -- | |
| Wells Fargo Bk | $190,800 | -- | |
| Wells Fargo Bk | $169,303 | -- | |
| Houle David A | $125,500 | -- |
Source: Public Records
Mortgage History
| Date | Status | Borrower | Loan Amount |
|---|---|---|---|
| Previous Owner | Houle David A | $125,701 |
Source: Public Records
Tax History
| Year | Tax Paid | Tax Assessment Tax Assessment Total Assessment is a certain percentage of the fair market value that is determined by local assessors to be the total taxable value of land and additions on the property. | Land | Improvement |
|---|---|---|---|---|
| 2025 | $6,269 | $413,500 | $95,800 | $317,700 |
| 2024 | $5,826 | $394,700 | $93,900 | $300,800 |
| 2023 | $5,413 | $357,300 | $85,400 | $271,900 |
| 2022 | $5,393 | $317,400 | $74,300 | $243,100 |
| 2021 | $5,132 | $291,400 | $67,500 | $223,900 |
| 2020 | $4,835 | $276,900 | $67,500 | $209,400 |
| 2019 | $4,639 | $258,300 | $67,500 | $190,800 |
| 2018 | $4,546 | $248,300 | $64,300 | $184,000 |
| 2017 | $4,279 | $247,200 | $64,300 | $182,900 |
| 2016 | $3,849 | $227,600 | $64,300 | $163,300 |
| 2015 | $3,848 | $219,400 | $64,300 | $155,100 |
| 2014 | $1,924 | $219,400 | $64,300 | $155,100 |
Source: Public Records
Map
Nearby Homes
Your Personal Tour Guide
Ask me questions while you tour the home.