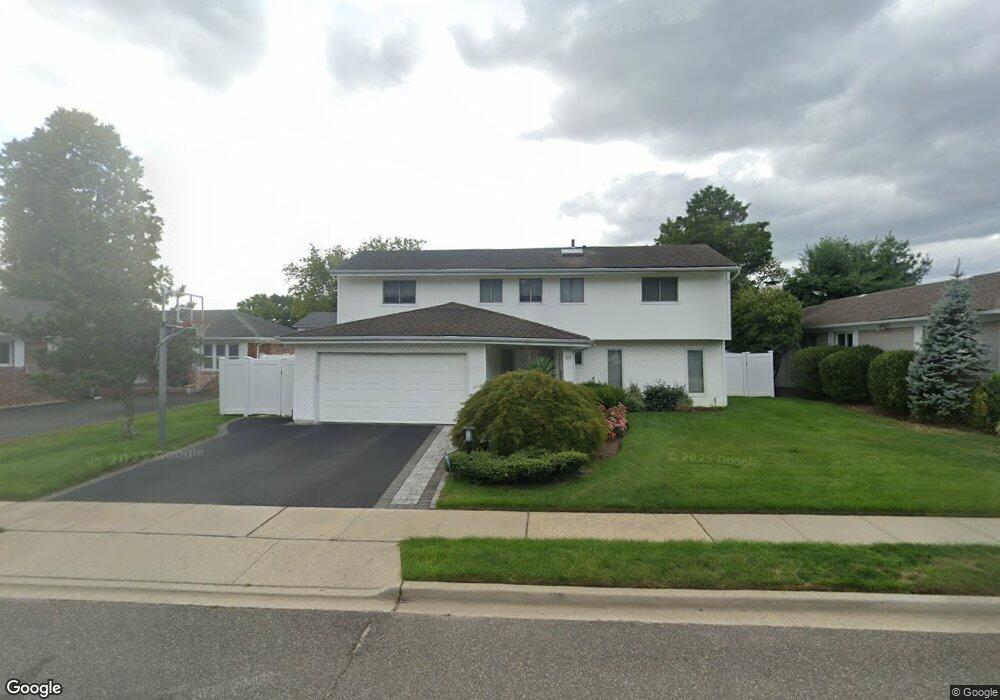
40 Joyce Rd Plainview, NY 11803
Estimated Value: $926,000 - $1,070,461
Studio
3
Baths
1,584
Sq Ft
$630/Sq Ft
Est. Value
About This Home
This home is located at 40 Joyce Rd, Plainview, NY 11803 and is currently estimated at $998,231, approximately $630 per square foot. 40 Joyce Rd is a home located in Nassau County with nearby schools including Pasadena Elementary School, Plainview Old Bethpage Middle School, and Plainview-Old Bethpage John F. Kennedy High School.
Ownership History
Date
Name
Owned For
Owner Type
Purchase Details
Closed on
Oct 14, 2011
Sold by
Blansky David and Blansky Stacey
Bought by
Landler Michael E and Landler Carrie D
Current Estimated Value
Home Financials for this Owner
Home Financials are based on the most recent Mortgage that was taken out on this home.
Original Mortgage
$498,000
Outstanding Balance
$339,819
Interest Rate
4.11%
Mortgage Type
Purchase Money Mortgage
Estimated Equity
$658,412
Purchase Details
Closed on
Feb 27, 2003
Sold by
Springer Peter
Bought by
Blansky David
Create a Home Valuation Report for This Property
The Home Valuation Report is an in-depth analysis detailing your home's value as well as a comparison with similar homes in the area
Home Values in the Area
Average Home Value in this Area
Purchase History
| Date | Buyer | Sale Price | Title Company |
|---|---|---|---|
| Landler Michael E | $635,000 | -- | |
| Blansky David | $507,500 | -- |
Source: Public Records
Mortgage History
| Date | Status | Borrower | Loan Amount |
|---|---|---|---|
| Open | Landler Michael E | $498,000 |
Source: Public Records
Tax History
| Year | Tax Paid | Tax Assessment Tax Assessment Total Assessment is a certain percentage of the fair market value that is determined by local assessors to be the total taxable value of land and additions on the property. | Land | Improvement |
|---|---|---|---|---|
| 2025 | $18,683 | $629 | $275 | $354 |
| 2024 | $5,016 | $599 | $262 | $337 |
Source: Public Records
Map
Nearby Homes
- 15 Elaine Place
- 13 Cynthia Ln
- 68 Beaumont Dr
- 39 Garnet Ln
- 50 Netto Ln
- 4 Cranford Rd
- 93 Palo Alto Dr
- 7 Sebree Place
- 8 Sebree Place
- 42 Briarwood Ln
- 5 Pine St
- 37 Santa Barbara Dr
- 128 Santa Barbara Dr
- 78 Santa Barbara Dr
- 48 Robin Ln
- 31 Steven St
- 85 Roundtree Dr
- 6 Cedar Dr E
- 61 Stephen Dr
- 20 Briarwood Ln
Your Personal Tour Guide
Ask me questions while you tour the home.