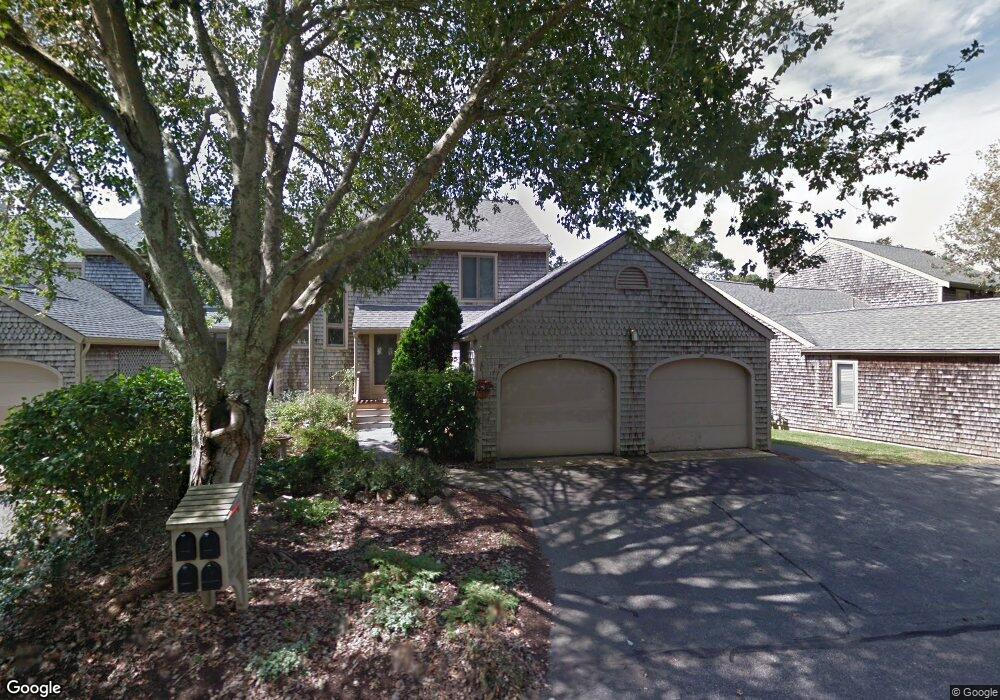
40 Landfall Unit 5-4 Falmouth, MA 02540
Falmouth Village NeighborhoodEstimated Value: $1,072,000 - $1,214,602
3
Beds
4
Baths
2,201
Sq Ft
$509/Sq Ft
Est. Value
About This Home
This home is located at 40 Landfall Unit 5-4, Falmouth, MA 02540 and is currently estimated at $1,120,151, approximately $508 per square foot. 40 Landfall Unit 5-4 is a home located in Barnstable County with nearby schools including Mullen-Hall School, Lawrence School, and Morse Pond School.
Ownership History
Date
Name
Owned For
Owner Type
Purchase Details
Closed on
Feb 26, 2013
Sold by
Goldstein Steven M and Kates Erika
Bought by
Falmouth S M Goldstein and Goldstein Steven M
Current Estimated Value
Purchase Details
Closed on
Jan 28, 2000
Sold by
Kelley Mary Jane
Bought by
Goldstein Steven M and Kates Erika
Create a Home Valuation Report for This Property
The Home Valuation Report is an in-depth analysis detailing your home's value as well as a comparison with similar homes in the area
Home Values in the Area
Average Home Value in this Area
Purchase History
| Date | Buyer | Sale Price | Title Company |
|---|---|---|---|
| Falmouth S M Goldstein | -- | -- | |
| Goldstein Steven M | $338,500 | -- |
Source: Public Records
Mortgage History
| Date | Status | Borrower | Loan Amount |
|---|---|---|---|
| Previous Owner | Goldstein Steven M | $25,000 | |
| Previous Owner | Goldstein Steven M | $80,000 |
Source: Public Records
Tax History Compared to Growth
Tax History
| Year | Tax Paid | Tax Assessment Tax Assessment Total Assessment is a certain percentage of the fair market value that is determined by local assessors to be the total taxable value of land and additions on the property. | Land | Improvement |
|---|---|---|---|---|
| 2025 | $5,787 | $985,800 | $0 | $985,800 |
| 2024 | $4,307 | $685,900 | $0 | $685,900 |
| 2023 | $4,456 | $643,900 | $0 | $643,900 |
| 2022 | $4,900 | $608,700 | $0 | $608,700 |
| 2021 | $4,087 | $480,800 | $0 | $480,800 |
| 2020 | $4,130 | $480,800 | $0 | $480,800 |
| 2019 | $4,245 | $495,900 | $0 | $495,900 |
| 2018 | $4,106 | $477,400 | $0 | $477,400 |
| 2017 | $4,070 | $477,100 | $0 | $477,100 |
| 2016 | $4,128 | $493,200 | $0 | $493,200 |
| 2015 | $4,039 | $493,200 | $0 | $493,200 |
| 2014 | $3,524 | $432,400 | $0 | $432,400 |
Source: Public Records
Map
Nearby Homes
- 38 Landfall Unit 38
- 38 Landfall
- 251 Woods Hole Rd
- 87 Oyster Pond Rd
- 15 Hedge Ln
- 45 Haynes Ave
- 71 Main St
- 27 Upland Ave
- 65 Walker St
- 98 Main St
- 98 Main St Unit 1
- 76 F r Lillie Rd
- 30 Katherine Lee Bates Rd
- 33 Oakwood Ave
- 29 Wilson Rd
- 480 Main St Unit 1
- 10 Shanks Pond Rd
- 110 Dillingham Ave Unit 322
- 54 Whitman Rd
- 253 Scranton Ave