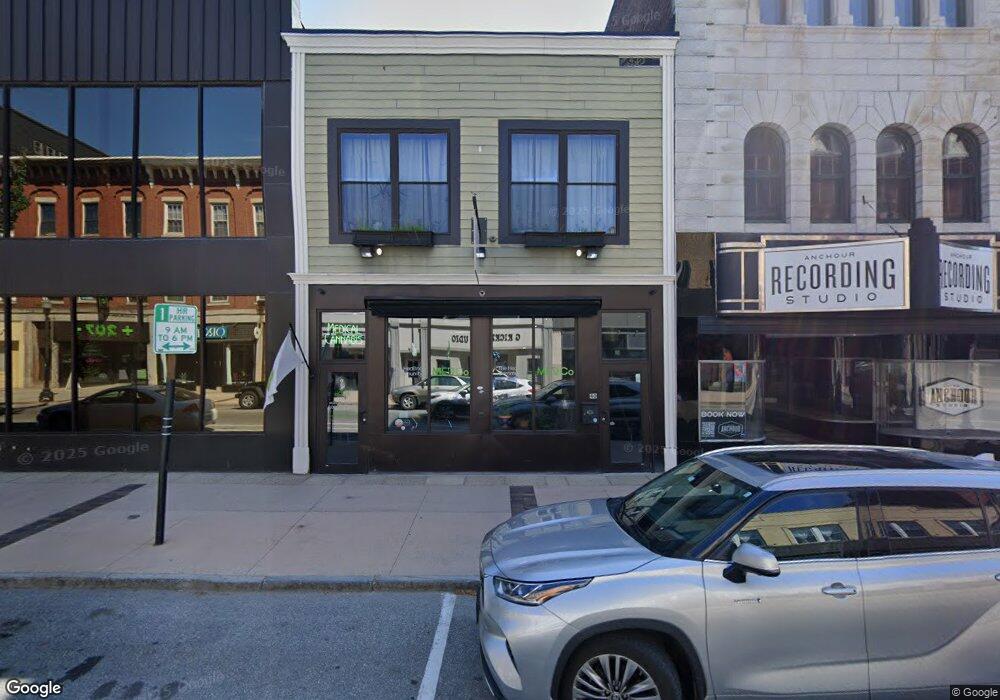
40 Lisbon St Lewiston, ME 04240
3
Beds
2
Baths
4,224
Sq Ft
2,178
Sq Ft Lot
About This Home
This home is located at 40 Lisbon St, Lewiston, ME 04240. 40 Lisbon St is a home located in Androscoggin County with nearby schools including Montello School, Lewiston High School, and Central Maine Christian Academy.
Ownership History
Date
Name
Owned For
Owner Type
Purchase Details
Closed on
Aug 19, 2025
Sold by
Hall Gary L and Hall Susan C
Bought by
Lisbon Street Prop Llc
Purchase Details
Closed on
Jul 3, 2014
Sold by
40 Lisbon Llc
Bought by
Hall Gary L and Hall Susan C
Home Financials for this Owner
Home Financials are based on the most recent Mortgage that was taken out on this home.
Original Mortgage
$295,000
Interest Rate
4.16%
Mortgage Type
Commercial
Purchase Details
Closed on
Jul 2, 2009
Sold by
Pioneer Capital Corp
Bought by
40 Lisbon Llc
Purchase Details
Closed on
Feb 27, 2009
Sold by
Pioneer Capital Corp and Ideal Real Estate Llc
Bought by
Ideal Real Estate Llc
Purchase Details
Closed on
Apr 1, 2008
Sold by
Greely Capital Llc
Bought by
Ideal Real Estate Llc
Purchase Details
Closed on
Apr 9, 2007
Sold by
Ruso Llc
Bought by
Greely Capital Llc
Create a Home Valuation Report for This Property
The Home Valuation Report is an in-depth analysis detailing your home's value as well as a comparison with similar homes in the area
Home Values in the Area
Average Home Value in this Area
Purchase History
| Date | Buyer | Sale Price | Title Company |
|---|---|---|---|
| Lisbon Street Prop Llc | -- | -- | |
| Hall Gary L | -- | -- | |
| Hall Gary L | -- | -- | |
| Hall Gary L | -- | -- | |
| 40 Lisbon Llc | -- | -- | |
| 40 Lisbon Llc | -- | -- | |
| Ideal Real Estate Llc | -- | -- | |
| Ideal Real Estate Llc | -- | -- | |
| Ideal Real Estate Llc | -- | -- | |
| Ideal Real Estate Llc | -- | -- | |
| Greely Capital Llc | -- | -- | |
| Greely Capital Llc | -- | -- |
Source: Public Records
Mortgage History
| Date | Status | Borrower | Loan Amount |
|---|---|---|---|
| Previous Owner | Hall Gary L | $295,000 |
Source: Public Records
Tax History Compared to Growth
Tax History
| Year | Tax Paid | Tax Assessment Tax Assessment Total Assessment is a certain percentage of the fair market value that is determined by local assessors to be the total taxable value of land and additions on the property. | Land | Improvement |
|---|---|---|---|---|
| 2025 | $6,651 | $202,900 | $34,500 | $168,400 |
| 2024 | $6,446 | $202,900 | $34,500 | $168,400 |
| 2023 | $6,087 | $202,900 | $34,500 | $168,400 |
| 2022 | $5,079 | $178,200 | $34,500 | $143,700 |
| 2021 | $5,036 | $178,200 | $34,500 | $143,700 |
| 2020 | $5,769 | $151,840 | $34,500 | $117,340 |
| 2019 | $5,769 | $151,840 | $34,500 | $117,340 |
| 2018 | $5,752 | $151,840 | $34,500 | $117,340 |
| 2017 | $4,255 | $151,840 | $34,500 | $117,340 |
| 2016 | $5,429 | $151,840 | $34,500 | $117,340 |
| 2015 | $4,156 | $151,840 | $34,500 | $117,340 |
| 2014 | $4,037 | $151,840 | $34,500 | $117,340 |
| 2013 | $4,015 | $151,840 | $34,500 | $117,340 |
Source: Public Records
Map
Nearby Homes