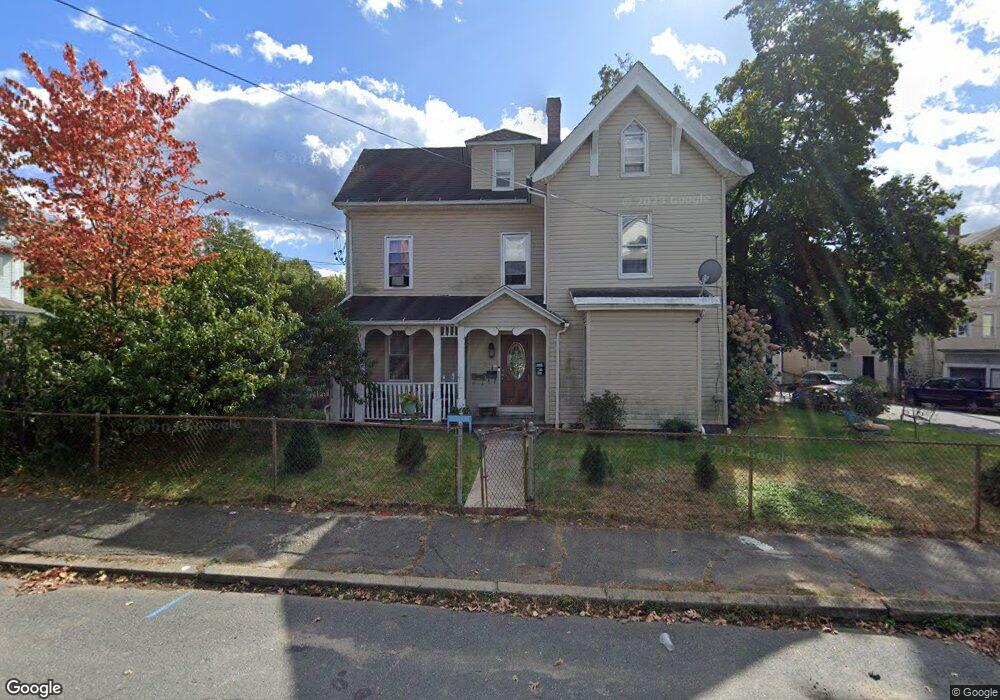
40 Luke St Waterbury, CT 06706
South End District NeighborhoodEstimated Value: $395,000 - $468,000
7
Beds
4
Baths
3,545
Sq Ft
$123/Sq Ft
Est. Value
About This Home
This home is located at 40 Luke St, Waterbury, CT 06706 and is currently estimated at $437,427, approximately $123 per square foot. 40 Luke St is a home located in New Haven County with nearby schools including Washington School, West Side Middle School, and Crosby High School.
Ownership History
Date
Name
Owned For
Owner Type
Purchase Details
Closed on
Oct 5, 2006
Sold by
Gomes Camila G
Bought by
Nunez Maria
Current Estimated Value
Home Financials for this Owner
Home Financials are based on the most recent Mortgage that was taken out on this home.
Original Mortgage
$228,000
Outstanding Balance
$136,653
Interest Rate
6.54%
Mortgage Type
Purchase Money Mortgage
Estimated Equity
$300,774
Purchase Details
Closed on
May 3, 2004
Sold by
Desouza Lucimeire E and Desouza Rawlinson
Bought by
Games Camilo G
Purchase Details
Closed on
Aug 28, 1998
Sold by
Medeiros Jose M and Medeiros Maria F
Bought by
Rodrigues Lucimeire
Purchase Details
Closed on
Jan 30, 1997
Sold by
Dowling Jane and Reilly Joe
Bought by
Medeiros Jose and Medeiros Maria
Create a Home Valuation Report for This Property
The Home Valuation Report is an in-depth analysis detailing your home's value as well as a comparison with similar homes in the area
Home Values in the Area
Average Home Value in this Area
Purchase History
| Date | Buyer | Sale Price | Title Company |
|---|---|---|---|
| Nunez Maria | $285,000 | -- | |
| Games Camilo G | $160,000 | -- | |
| Rodrigues Lucimeire | $92,000 | -- | |
| Medeiros Jose | $79,000 | -- |
Source: Public Records
Mortgage History
| Date | Status | Borrower | Loan Amount |
|---|---|---|---|
| Open | Medeiros Jose | $228,000 | |
| Closed | Medeiros Jose | $57,000 | |
| Previous Owner | Medeiros Jose | $238,500 |
Source: Public Records
Tax History Compared to Growth
Tax History
| Year | Tax Paid | Tax Assessment Tax Assessment Total Assessment is a certain percentage of the fair market value that is determined by local assessors to be the total taxable value of land and additions on the property. | Land | Improvement |
|---|---|---|---|---|
| 2025 | $8,183 | $181,930 | $15,190 | $166,740 |
| 2024 | $8,995 | $181,930 | $15,190 | $166,740 |
| 2023 | $9,859 | $181,930 | $15,190 | $166,740 |
| 2022 | $5,745 | $95,420 | $15,200 | $80,220 |
| 2021 | $5,745 | $95,420 | $15,200 | $80,220 |
| 2020 | $5,745 | $95,420 | $15,200 | $80,220 |
| 2019 | $5,745 | $95,420 | $15,200 | $80,220 |
| 2018 | $5,745 | $95,420 | $15,200 | $80,220 |
| 2017 | $6,383 | $106,020 | $15,190 | $90,830 |
| 2016 | $6,383 | $106,020 | $15,190 | $90,830 |
| 2015 | $6,172 | $106,020 | $15,190 | $90,830 |
| 2014 | $6,172 | $106,020 | $15,190 | $90,830 |
Source: Public Records
Map
Nearby Homes