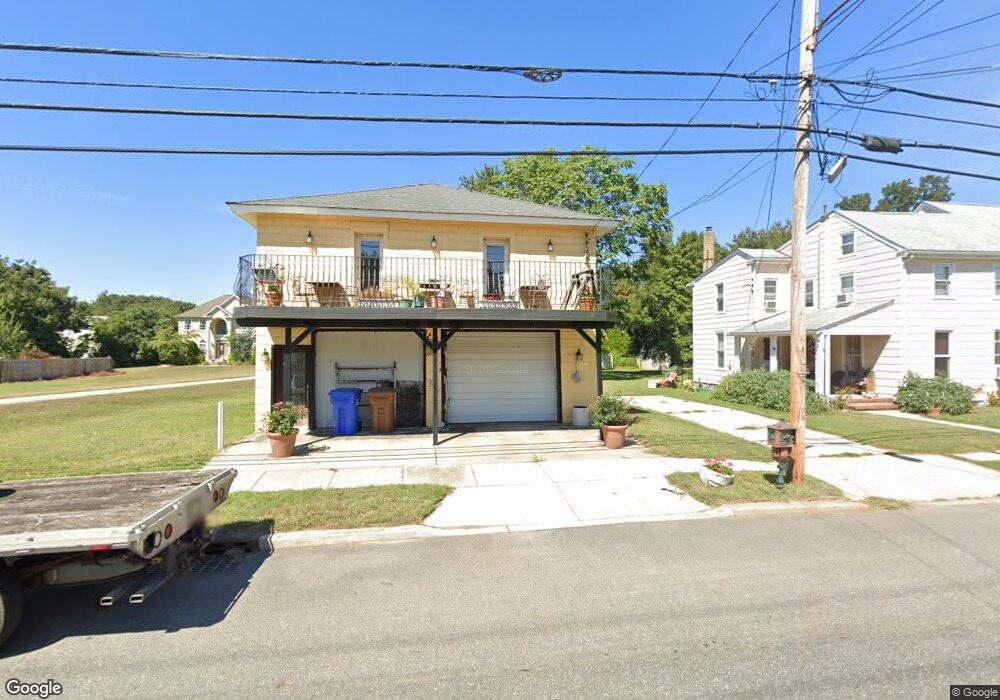
40 Main St Bridgeport, NJ 08014
Logan Township NeighborhoodEstimated Value: $166,000 - $344,000
--
Bed
--
Bath
2,113
Sq Ft
$104/Sq Ft
Est. Value
About This Home
This home is located at 40 Main St, Bridgeport, NJ 08014 and is currently estimated at $220,465, approximately $104 per square foot. 40 Main St is a home located in Gloucester County with nearby schools including Logan Township Elementary School.
Ownership History
Date
Name
Owned For
Owner Type
Purchase Details
Closed on
Mar 23, 2013
Sold by
Pollock Randall and Pollock Rita R
Bought by
Pollock Randall
Current Estimated Value
Home Financials for this Owner
Home Financials are based on the most recent Mortgage that was taken out on this home.
Original Mortgage
$123,500
Outstanding Balance
$87,072
Interest Rate
3.52%
Mortgage Type
New Conventional
Estimated Equity
$133,393
Purchase Details
Closed on
Oct 14, 1999
Sold by
Morris James R and Morris Cynthia A
Bought by
Pollock Randall
Home Financials for this Owner
Home Financials are based on the most recent Mortgage that was taken out on this home.
Original Mortgage
$25,000
Interest Rate
7%
Mortgage Type
Seller Take Back
Purchase Details
Closed on
Nov 14, 1994
Sold by
Logan Township Memorial Post #10414 Vete
Bought by
Shiveler Walter
Create a Home Valuation Report for This Property
The Home Valuation Report is an in-depth analysis detailing your home's value as well as a comparison with similar homes in the area
Home Values in the Area
Average Home Value in this Area
Purchase History
| Date | Buyer | Sale Price | Title Company |
|---|---|---|---|
| Pollock Randall | -- | None Available | |
| Pollock Randall | $35,000 | Fidelity National Title Ins | |
| Shiveler Walter | -- | Victorian Title Agency Inc |
Source: Public Records
Mortgage History
| Date | Status | Borrower | Loan Amount |
|---|---|---|---|
| Open | Pollock Randall | $123,500 | |
| Closed | Pollock Randall | $25,000 |
Source: Public Records
Tax History Compared to Growth
Tax History
| Year | Tax Paid | Tax Assessment Tax Assessment Total Assessment is a certain percentage of the fair market value that is determined by local assessors to be the total taxable value of land and additions on the property. | Land | Improvement |
|---|---|---|---|---|
| 2025 | $2,729 | $167,700 | $16,500 | $151,200 |
| 2024 | $2,183 | $167,700 | $16,500 | $151,200 |
| 2023 | $2,183 | $108,600 | $5,200 | $103,400 |
| 2022 | $2,269 | $108,600 | $5,200 | $103,400 |
| 2021 | $1,579 | $108,600 | $5,200 | $103,400 |
| 2020 | $2,362 | $108,600 | $5,200 | $103,400 |
| 2019 | $2,359 | $108,600 | $5,200 | $103,400 |
| 2018 | $2,294 | $108,600 | $5,200 | $103,400 |
| 2017 | $3,059 | $122,000 | $5,200 | $116,800 |
| 2016 | $2,759 | $122,000 | $5,200 | $116,800 |
| 2015 | $2,410 | $122,000 | $5,200 | $116,800 |
| 2014 | $2,329 | $122,000 | $5,200 | $116,800 |
Source: Public Records
Map
Nearby Homes
- 33 Mechanic St
- 71 Main St
- 126 Repaupo Station Rd
- 17 Hickory Ln
- 43 45 Repaupo Station Rd
- 788 Paulsboro Rd
- 792 Paulsboro Rd
- 103 Highland Ave
- 103 Thurlow St Unit 306
- 223 Jeffrey St
- 12 Parker St
- 0 Palmer St Unit PADE2073654
- 2821 W 3rd St
- 112 Carriage Ln
- 803 W Mary St
- 1402 W 3rd St
- 2325 W 4th St
- 220 Kerlin St
- 321 Tilghman St
- 321 Highland Ave