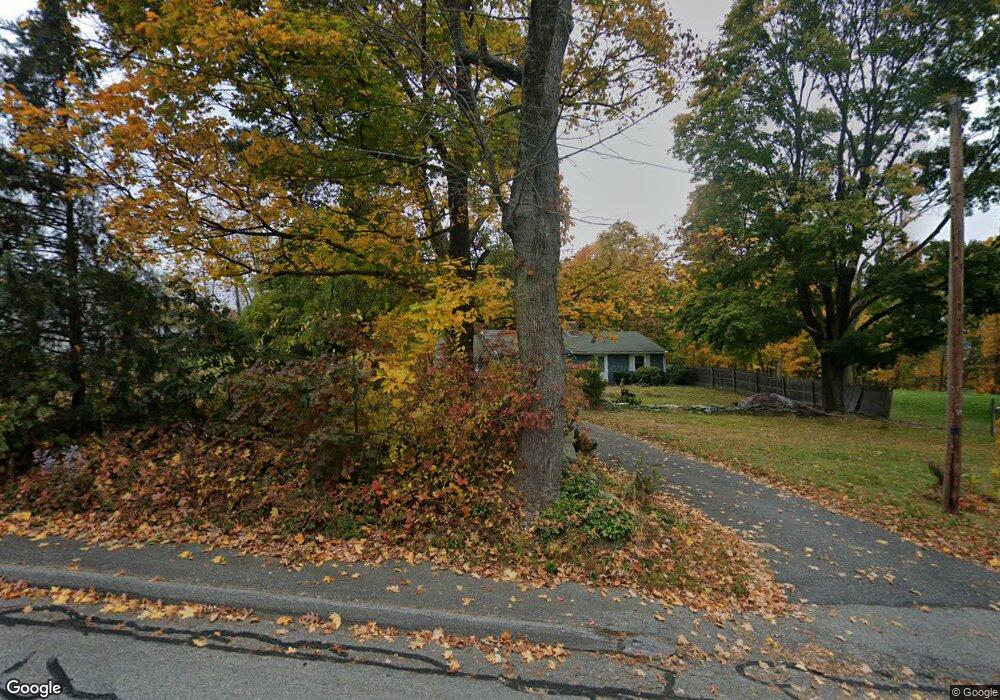
40 Main St Southborough, MA 01772
Estimated Value: $761,306
3
Beds
3
Baths
3,629
Sq Ft
$210/Sq Ft
Est. Value
About This Home
This home is located at 40 Main St, Southborough, MA 01772 and is currently estimated at $761,306, approximately $209 per square foot. 40 Main St is a home located in Worcester County with nearby schools including Mary E Finn School, Albert S. Woodward Memorial School, and Margaret A. Neary School.
Ownership History
Date
Name
Owned For
Owner Type
Purchase Details
Closed on
Mar 5, 2012
Sold by
Donald C Morris T C and Donald Morris
Bought by
Morris Stephen D and Morris Nancy G
Current Estimated Value
Home Financials for this Owner
Home Financials are based on the most recent Mortgage that was taken out on this home.
Original Mortgage
$330,000
Outstanding Balance
$228,088
Interest Rate
4%
Mortgage Type
Commercial
Estimated Equity
$533,218
Create a Home Valuation Report for This Property
The Home Valuation Report is an in-depth analysis detailing your home's value as well as a comparison with similar homes in the area
Home Values in the Area
Average Home Value in this Area
Purchase History
| Date | Buyer | Sale Price | Title Company |
|---|---|---|---|
| Morris Stephen D | $412,500 | -- | |
| Morris Stephen D | $412,500 | -- |
Source: Public Records
Mortgage History
| Date | Status | Borrower | Loan Amount |
|---|---|---|---|
| Open | Morris Stephen D | $330,000 | |
| Closed | Morris Stephen D | $330,000 |
Source: Public Records
Tax History Compared to Growth
Tax History
| Year | Tax Paid | Tax Assessment Tax Assessment Total Assessment is a certain percentage of the fair market value that is determined by local assessors to be the total taxable value of land and additions on the property. | Land | Improvement |
|---|---|---|---|---|
| 2025 | $9,638 | $697,900 | $251,400 | $446,500 |
| 2024 | $9,635 | $692,700 | $251,400 | $441,300 |
| 2023 | $9,132 | $618,700 | $247,000 | $371,700 |
| 2022 | $9,048 | $555,800 | $237,800 | $318,000 |
| 2021 | $8,959 | $552,700 | $237,800 | $314,900 |
| 2020 | $9,175 | $550,700 | $218,600 | $332,100 |
| 2019 | $9,376 | $560,100 | $218,600 | $341,500 |
| 2018 | $9,040 | $560,100 | $218,600 | $341,500 |
| 2017 | $9,174 | $560,100 | $218,600 | $341,500 |
| 2016 | $8,778 | $554,872 | $199,186 | $355,686 |
| 2015 | $8,849 | $552,400 | $212,000 | $340,400 |
Source: Public Records
Map
Nearby Homes
- Lot 2 Quinn Rd
- 25 Park St
- 36 E Main St
- 58 Framingham Rd
- 56 Sears Rd
- lot 1 Sears Rd
- 9 John Matthews Rd
- 20 Clifford Rd
- 150 Framingham Rd
- 19 Maplecrest Dr
- 7 John St
- 8 Lorenzo Dr
- 14 Lovers Ln
- 11 Skylar Dr
- 15 Lovers Ln
- 6 Eastbrook Farm Ln
- 9 Cherry St
- 1 Carriage Hill Cir Unit 1
- 61-65 Turnpike
- 105 Fisher Rd