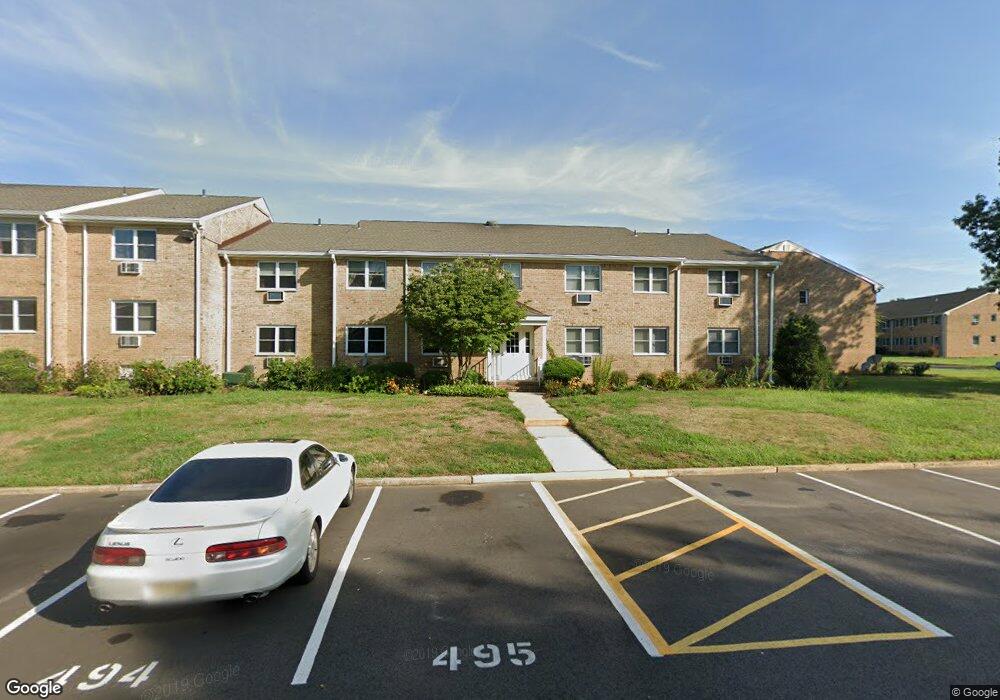
40 Manchester Ct Unit H Freehold, NJ 07728
Estimated Value: $188,000 - $233,000
1
Bed
1
Bath
712
Sq Ft
$311/Sq Ft
Est. Value
About This Home
This home is located at 40 Manchester Ct Unit H, Freehold, NJ 07728 and is currently estimated at $221,204, approximately $310 per square foot. 40 Manchester Ct Unit H is a home located in Monmouth County with nearby schools including Laura Donovan Elementary School, Clifton T. Barkalow Middle School, and Freehold Township High School.
Ownership History
Date
Name
Owned For
Owner Type
Purchase Details
Closed on
Dec 14, 2007
Sold by
Chang Arnold
Bought by
Vazquez Pablo B
Current Estimated Value
Home Financials for this Owner
Home Financials are based on the most recent Mortgage that was taken out on this home.
Original Mortgage
$102,100
Outstanding Balance
$64,324
Interest Rate
6.21%
Mortgage Type
Purchase Money Mortgage
Estimated Equity
$156,880
Purchase Details
Closed on
Jul 14, 2004
Sold by
Chanowich Gina
Bought by
Chang Arnold
Home Financials for this Owner
Home Financials are based on the most recent Mortgage that was taken out on this home.
Original Mortgage
$82,000
Interest Rate
6.28%
Purchase Details
Closed on
Aug 28, 1997
Sold by
Quintiliano Manuel
Bought by
Jennete Gina
Home Financials for this Owner
Home Financials are based on the most recent Mortgage that was taken out on this home.
Original Mortgage
$30,000
Interest Rate
7.41%
Create a Home Valuation Report for This Property
The Home Valuation Report is an in-depth analysis detailing your home's value as well as a comparison with similar homes in the area
Home Values in the Area
Average Home Value in this Area
Purchase History
| Date | Buyer | Sale Price | Title Company |
|---|---|---|---|
| Vazquez Pablo B | $120,000 | Fidelity Natl Title Ins Co | |
| Chang Arnold | $122,000 | -- | |
| Jennete Gina | $33,400 | -- |
Source: Public Records
Mortgage History
| Date | Status | Borrower | Loan Amount |
|---|---|---|---|
| Open | Vazquez Pablo B | $102,100 | |
| Previous Owner | Chang Arnold | $82,000 | |
| Previous Owner | Jennete Gina | $30,000 |
Source: Public Records
Tax History Compared to Growth
Tax History
| Year | Tax Paid | Tax Assessment Tax Assessment Total Assessment is a certain percentage of the fair market value that is determined by local assessors to be the total taxable value of land and additions on the property. | Land | Improvement |
|---|---|---|---|---|
| 2025 | $2,997 | $198,000 | $120,000 | $78,000 |
| 2024 | $2,921 | $165,600 | $111,000 | $54,600 |
| 2023 | $2,921 | $156,700 | $100,000 | $56,700 |
| 2022 | $2,473 | $128,900 | $75,000 | $53,900 |
| 2021 | $2,473 | $114,700 | $65,000 | $49,700 |
| 2020 | $2,394 | $110,300 | $62,000 | $48,300 |
| 2019 | $2,410 | $110,300 | $62,000 | $48,300 |
| 2018 | $2,138 | $95,700 | $50,000 | $45,700 |
| 2017 | $1,846 | $81,300 | $40,000 | $41,300 |
| 2016 | $1,867 | $80,500 | $40,000 | $40,500 |
| 2015 | $1,590 | $69,400 | $30,000 | $39,400 |
| 2014 | $1,615 | $67,600 | $30,000 | $37,600 |
Source: Public Records
Map
Nearby Homes
- 26 Windsor Terrace Unit E
- 39 Coachman Dr S
- 43 Juniper Dr
- 33 Willow Brook Rd
- 98 Woody Rd
- 20 Austin Ct Unit 7
- 75 Robin Place
- 2 Fortune Ct
- 176 Farm Rd
- 7 Stuart Dr Unit 5
- 52 Yorke Ct
- 16 Irwin Ave
- 49 Polo Club Dr
- 2808 Kapalua Ct
- 32 Woods Rd
- 34 Polo Club Dr
- 21 Alexander Ave
- 2610 Metedeconk
- 3510 Scarecrow Ct Unit 3510
- 4008 Corral Ct
- 40 Manchester Ct Unit C
- 40 Manchester Ct Unit B
- 40 Manchester Ct Unit F
- 40 Manchester Ct Unit A
- 40 Manchester Ct Unit G
- 40 Manchester Ct Unit E
- 40 Manchester Ct Unit D
- 40 Manchester Ct
- 36 Manchester Ct Unit E
- 36 Manchester Ct Unit B
- 36 Manchester Ct Unit A
- 36 Manchester Ct Unit C
- 36 Manchester Ct Unit H
- 36 Manchester Ct Unit G
- 36 Manchester Ct Unit F
- 36 Manchester Ct Unit D
- 36 Manchester Ct
- 44 Manchester Ct Unit E
- 44 Manchester Ct Unit G
- 44 Manchester Ct Unit F