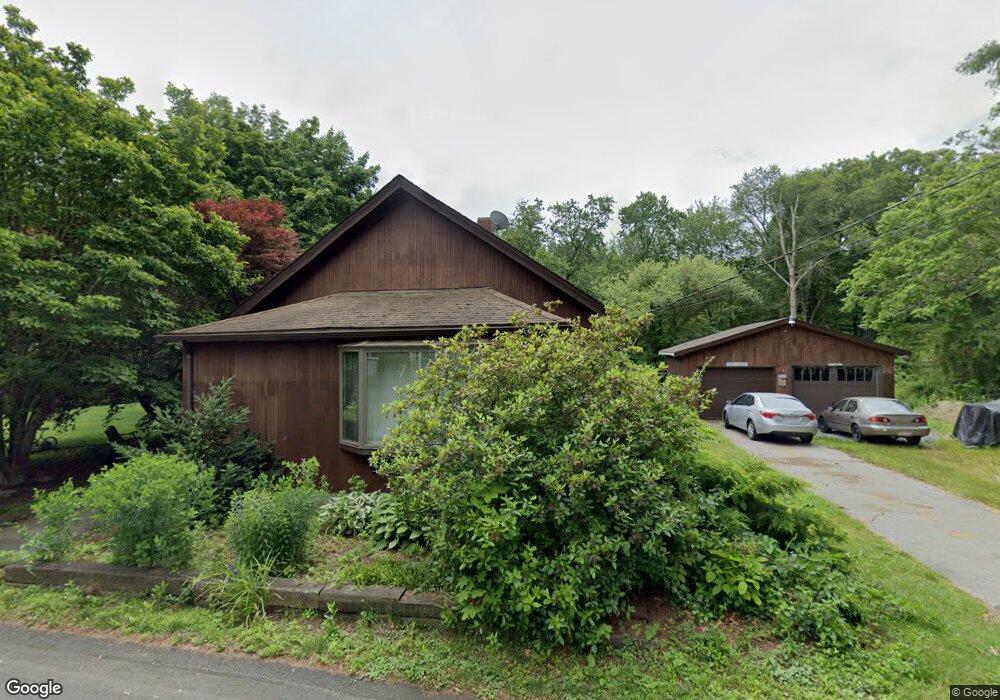
40 Maple St Westport, MA 02790
North Westport NeighborhoodEstimated Value: $416,902 - $521,000
2
Beds
--
Bath
1,468
Sq Ft
$315/Sq Ft
Est. Value
About This Home
This home is located at 40 Maple St, Westport, MA 02790 and is currently estimated at $462,476, approximately $315 per square foot. 40 Maple St is a home located in Bristol County with nearby schools including Alice A. Macomber Primary School, Westport Elementary School, and Westport Middle-High School.
Ownership History
Date
Name
Owned For
Owner Type
Purchase Details
Closed on
Jan 27, 2023
Sold by
Rebello Bradley S
Bought by
Rebello Bradley S and Rebello Sheila R
Current Estimated Value
Purchase Details
Closed on
Mar 27, 1998
Sold by
Medeiros Deborah A
Bought by
Rebello Bradley S
Create a Home Valuation Report for This Property
The Home Valuation Report is an in-depth analysis detailing your home's value as well as a comparison with similar homes in the area
Home Values in the Area
Average Home Value in this Area
Purchase History
| Date | Buyer | Sale Price | Title Company |
|---|---|---|---|
| Rebello Bradley S | -- | None Available | |
| Rebello Bradley S | $111,000 | -- |
Source: Public Records
Mortgage History
| Date | Status | Borrower | Loan Amount |
|---|---|---|---|
| Previous Owner | Rebello Bradley S | $289,240 | |
| Previous Owner | Rebello Bradley S | $251,823 |
Source: Public Records
Tax History
| Year | Tax Paid | Tax Assessment Tax Assessment Total Assessment is a certain percentage of the fair market value that is determined by local assessors to be the total taxable value of land and additions on the property. | Land | Improvement |
|---|---|---|---|---|
| 2025 | $2,429 | $326,100 | $147,200 | $178,900 |
| 2024 | $2,427 | $314,000 | $136,400 | $177,600 |
| 2023 | $2,255 | $276,400 | $123,700 | $152,700 |
| 2022 | $1,971 | $232,400 | $117,500 | $114,900 |
| 2021 | $3,804 | $221,800 | $106,800 | $115,000 |
| 2020 | $1,789 | $212,200 | $97,200 | $115,000 |
| 2019 | $10 | $207,800 | $97,200 | $110,600 |
| 2018 | $1,552 | $190,000 | $84,900 | $105,100 |
| 2017 | $1,538 | $193,000 | $90,700 | $102,300 |
| 2016 | $1,489 | $188,300 | $86,000 | $102,300 |
| 2015 | $1,469 | $185,200 | $98,800 | $86,400 |
Source: Public Records
Map
Nearby Homes
- 13 3rd Ave
- 116 Gifford Rd
- 16 Lenox Ave
- 15 S Breault St
- 2 Van Buren St
- 0 Hertitage Acres
- 565 Highland Ave
- 100 D Dr
- 3 Diane Way
- 2 Fieldstone Dr
- 1276 Old Fall River Rd
- 0 American Legion Hwy Unit 73473517
- 300 Davis Rd
- 358 Briggs Rd
- 2 Winterberry Ln
- 343 Old Bedford Rd
- 588 Gifford Rd
- 19 Charles Joseph Dr
- 320-322 Old Bedford Rd
- 2 Donna Marie Dr
Your Personal Tour Guide
Ask me questions while you tour the home.