Estimated Value: $264,741 - $366,000
--
Bed
--
Bath
2,341
Sq Ft
$144/Sq Ft
Est. Value
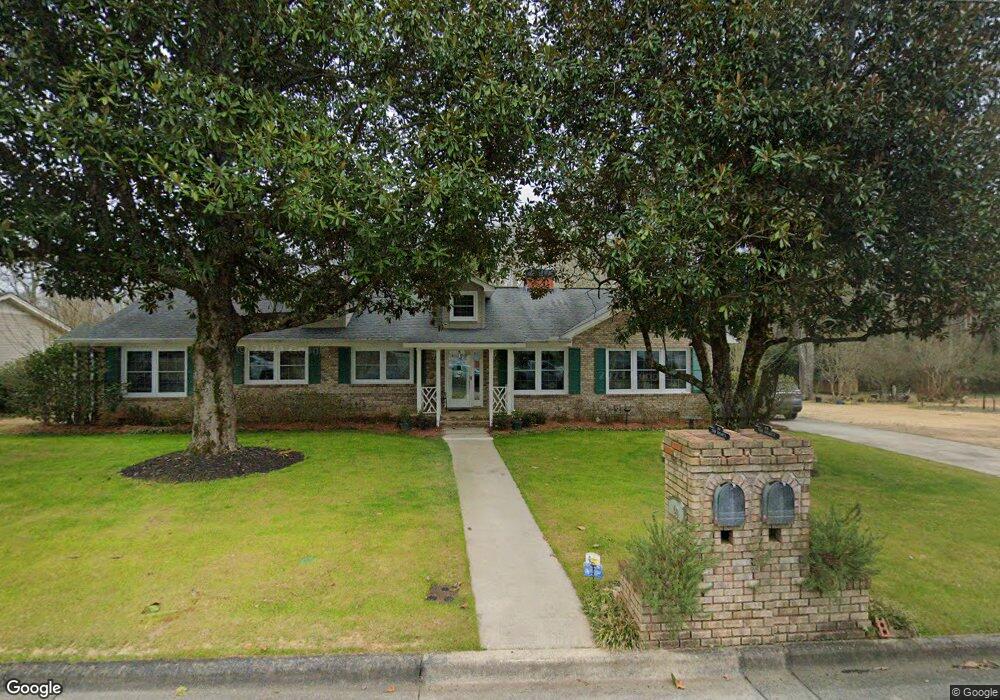
About This Home
This home is located at 40 Maplewood Square SE, Rome, GA 30161 and is currently estimated at $337,435, approximately $144 per square foot. 40 Maplewood Square SE is a home located in Floyd County with nearby schools including Rome High School, St. Mary School, and Unity Christian School.
Ownership History
Date
Name
Owned For
Owner Type
Purchase Details
Closed on
Oct 2, 1992
Sold by
Coley Susan Remarried
Bought by
Coley Robert H and Coley Susan
Current Estimated Value
Purchase Details
Closed on
Jun 16, 1979
Sold by
Maynor Susan Taylor
Bought by
Coley Susan Remarried
Purchase Details
Closed on
Sep 19, 1974
Sold by
Maynor Jimmy Lamar and Maynor Susan T
Bought by
Maynor Susan Taylor
Purchase Details
Closed on
Oct 1, 1973
Sold by
Maynor Jimmy Lamar
Bought by
Maynor Jimmy Lamar and Maynor Susan T
Purchase Details
Closed on
Jul 7, 1972
Sold by
Williams James P
Bought by
Maynor Jimmy Lamar
Purchase Details
Closed on
Mar 8, 1971
Sold by
Williams Const Co Of Rome
Bought by
Williams James P
Purchase Details
Closed on
Apr 5, 1968
Sold by
Howell Howell and Howell Covington
Bought by
Williams Const Co Of Rome
Purchase Details
Closed on
Aug 15, 1967
Bought by
Howell Howell and Howell Covington
Create a Home Valuation Report for This Property
The Home Valuation Report is an in-depth analysis detailing your home's value as well as a comparison with similar homes in the area
Home Values in the Area
Average Home Value in this Area
Purchase History
| Date | Buyer | Sale Price | Title Company |
|---|---|---|---|
| Coley Robert H | -- | -- | |
| Coley Susan Remarried | -- | -- | |
| Maynor Susan Taylor | -- | -- | |
| Maynor Jimmy Lamar | -- | -- | |
| Maynor Jimmy Lamar | $31,000 | -- | |
| Williams James P | -- | -- | |
| Williams Const Co Of Rome | -- | -- | |
| Howell Howell | -- | -- |
Source: Public Records
Tax History Compared to Growth
Tax History
| Year | Tax Paid | Tax Assessment Tax Assessment Total Assessment is a certain percentage of the fair market value that is determined by local assessors to be the total taxable value of land and additions on the property. | Land | Improvement |
|---|---|---|---|---|
| 2024 | $1,968 | $106,605 | $14,720 | $91,885 |
| 2023 | $1,870 | $102,784 | $13,340 | $89,444 |
| 2022 | $1,645 | $85,798 | $11,040 | $74,758 |
| 2021 | $1,405 | $71,617 | $11,040 | $60,577 |
| 2020 | $1,327 | $66,360 | $8,510 | $57,850 |
| 2019 | $1,260 | $63,433 | $8,510 | $54,923 |
| 2018 | $1,118 | $56,189 | $8,510 | $47,679 |
| 2017 | $1,096 | $54,904 | $8,510 | $46,394 |
| 2016 | $1,088 | $54,176 | $8,480 | $45,696 |
| 2015 | $1,043 | $54,936 | $8,480 | $46,456 |
| 2014 | $1,043 | $57,101 | $8,480 | $48,621 |
Source: Public Records
Map
Nearby Homes
- 26 Maplewood Square SE
- 22 Oakfield Dr SE
- 20 Mitchell Cir SE
- 100 Valley Brook Dr SE
- 14 Laurchris Dr SE
- 4 Mitchell Cir SE
- 227 W Lakeshore Dr SE
- 9 Heather Rd SE
- 0 Lakeshore Dr
- 11 Surrey Trail SE
- 6 Woodland Dr SE
- 120 Keown Rd SE
- 4 Coach Trail SE
- 15 Mimosa Dr SE
- 226 Maplecrest Ln SE
- 11 Breckenridge Rd SE
- 13 Breckenridge Rd SE
- 0 Georgia 293
- 8 Covey Rise Dr SE
- 40 Maplewood Square SE
- 42 Maplewood Square SE
- 0 Maplewood Square SE Unit 8214816
- 0 Maplewood Square SE Unit 8093502
- 0 Maplewood Square SE Unit 8035883
- 0 Maplewood Square SE Unit 8612968
- 0 Maplewood Square SE Unit 8718009
- 0 Maplewood Square SE Unit 9077103
- 0 Maplewood Square SE Unit 8939866
- 0 Maplewood Square SE Unit 3224578
- 33 Maplewood Square SE
- 35 Maplewood Square SE
- 44 Maplewood Square SE
- 36 Maplewood Square SE
- 31 Maplewood Square SE
- 37 Maplewood Square SE
- 29 Maplewood Square SE
- 46 Maplewood Square SE
- 34 Maplewood Square SE
- 39 Maplewood Square SE