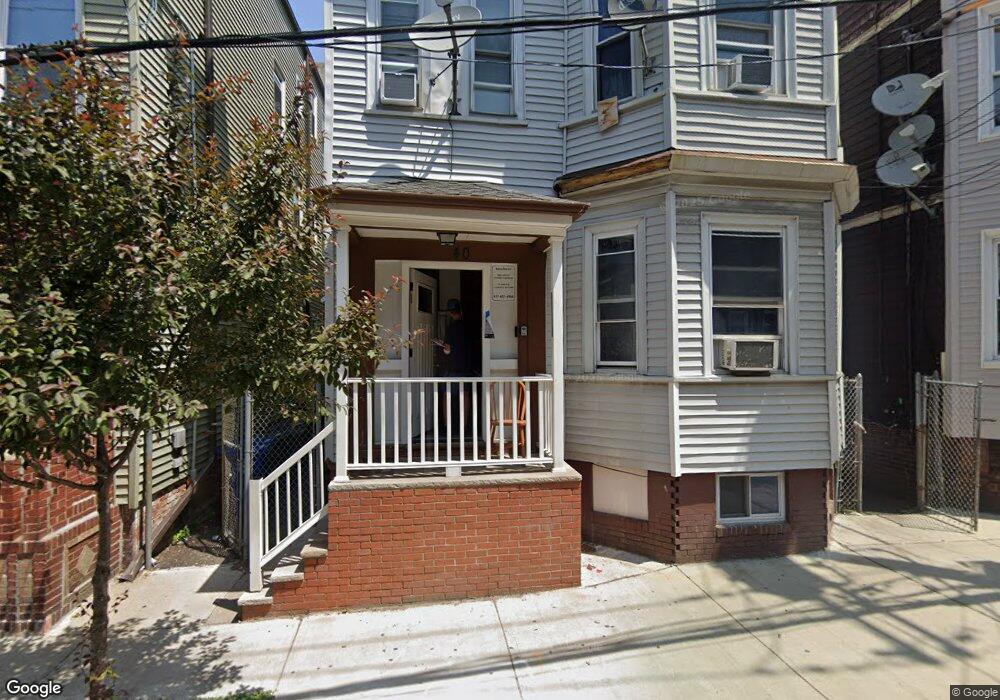
40 Marlborough St Chelsea, MA 02150
Bellingham Square NeighborhoodEstimated Value: $857,000 - $972,000
8
Beds
3
Baths
2,985
Sq Ft
$307/Sq Ft
Est. Value
About This Home
This home is located at 40 Marlborough St, Chelsea, MA 02150 and is currently estimated at $916,333, approximately $306 per square foot. 40 Marlborough St is a home located in Suffolk County with nearby schools including Chelsea High School and Phoenix Charter Academy - Chelsea.
Ownership History
Date
Name
Owned For
Owner Type
Purchase Details
Closed on
Jul 12, 2010
Sold by
Marder Eric D
Bought by
Marder
Current Estimated Value
Home Financials for this Owner
Home Financials are based on the most recent Mortgage that was taken out on this home.
Original Mortgage
$185,500
Outstanding Balance
$122,677
Interest Rate
4.78%
Mortgage Type
Purchase Money Mortgage
Estimated Equity
$793,656
Purchase Details
Closed on
Sep 16, 2008
Sold by
Montoya Oyuky
Bought by
Marder Eric D
Purchase Details
Closed on
Dec 17, 2007
Sold by
Montoya Oyuky and Flores Salvador M
Bought by
Montoya Oyuky
Purchase Details
Closed on
Jan 19, 2006
Sold by
Vega Nilda
Bought by
Montoya Oyuky
Purchase Details
Closed on
Feb 29, 2000
Sold by
Vega Miguel P and Vega Brenda E
Bought by
Vega Nilda
Create a Home Valuation Report for This Property
The Home Valuation Report is an in-depth analysis detailing your home's value as well as a comparison with similar homes in the area
Home Values in the Area
Average Home Value in this Area
Purchase History
| Date | Buyer | Sale Price | Title Company |
|---|---|---|---|
| Marder | -- | -- | |
| Marder | -- | -- | |
| E & M Marlboro Street Nt | -- | -- | |
| Marder Eric D | $210,500 | -- | |
| Marder Eric D | $210,500 | -- | |
| Montoya Oyuky | -- | -- | |
| Montoya Oyuky | -- | -- | |
| Montoya Oyuky | $385,000 | -- | |
| Montoya Oyuky | $385,000 | -- | |
| Vega Nilda | $165,900 | -- | |
| Vega Nilda | $165,900 | -- |
Source: Public Records
Mortgage History
| Date | Status | Borrower | Loan Amount |
|---|---|---|---|
| Open | E & M Marlboro Street Nt | $185,500 | |
| Closed | Vega Nilda | $185,500 |
Source: Public Records
Tax History Compared to Growth
Tax History
| Year | Tax Paid | Tax Assessment Tax Assessment Total Assessment is a certain percentage of the fair market value that is determined by local assessors to be the total taxable value of land and additions on the property. | Land | Improvement |
|---|---|---|---|---|
| 2025 | $8,469 | $735,800 | $145,500 | $590,300 |
| 2024 | $8,756 | $735,800 | $145,500 | $590,300 |
| 2023 | $8,404 | $678,800 | $132,300 | $546,500 |
| 2022 | $7,994 | $603,300 | $126,000 | $477,300 |
| 2021 | $7,710 | $566,100 | $120,000 | $446,100 |
| 2020 | $6,695 | $500,000 | $114,300 | $385,700 |
| 2019 | $6,016 | $422,200 | $114,300 | $307,900 |
| 2018 | $5,452 | $386,700 | $114,300 | $272,400 |
| 2017 | $5,217 | $363,800 | $114,300 | $249,500 |
| 2016 | $4,368 | $306,500 | $114,300 | $192,200 |
| 2015 | $3,793 | $263,400 | $99,400 | $164,000 |
| 2014 | $3,309 | $222,400 | $86,400 | $136,000 |
Source: Public Records
Map
Nearby Homes
- 221 Shurtleff St Unit 2
- 29 Cottage St
- 70 Chester Ave Unit 72
- 110 Bellingham St Unit 1
- 110 Bellingham St Unit 3
- 144 Library St
- 230 Chestnut St
- 50 Maverick St Unit 3
- 39 Cary Ave Unit 14
- 173 Walnut St Unit 3
- 33 Cary Ave Unit 11
- 65 6th St
- 139 Park St Unit 4
- 163 Chestnut St
- 250 Congress Ave Unit 40
- 175 Cottage St Unit 312
- 165 Cottage St Unit 611
- 165 Cottage St Unit 711
- 84 Tudor St Unit 4
- 78 Addison St Unit B
- 42 Marlborough St
- 38 Marlborough St
- 44 Marlborough St
- 36 Marlborough St
- 36 Marlborough St Unit 2
- 29 Library St
- 27 Library St
- 31 Library St
- 33 Library St
- 56 Marlborough St
- 26 Marlborough St
- 35 Marlboro St
- 35 Marlborough St
- 37 Marlborough St Unit 3
- 37 Marlborough St Unit 2
- 37 Marlborough St Unit 1
- 37 Marlborough St
- 37 Marlborough St Unit C
- 37 Marlborough St Unit B
- 41 Marlborough St