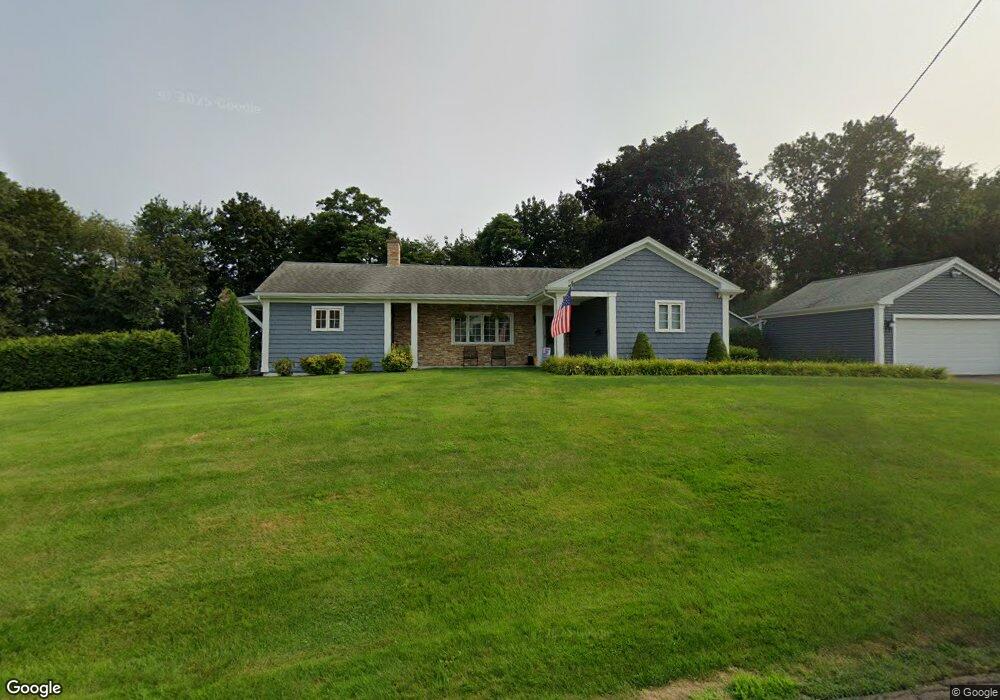
40 Mayer Dr Holyoke, MA 01040
Estimated Value: $321,000 - $449,000
3
Beds
2
Baths
1,845
Sq Ft
$201/Sq Ft
Est. Value
About This Home
This home is located at 40 Mayer Dr, Holyoke, MA 01040 and is currently estimated at $370,070, approximately $200 per square foot. 40 Mayer Dr is a home located in Hampden County with nearby schools including Lt. Elmer J. McMahon Elementary School, Lt. Clayre Sullivan Elementary School, and Holyoke High School.
Ownership History
Date
Name
Owned For
Owner Type
Purchase Details
Closed on
Jan 23, 2019
Sold by
Boryczka John F
Bought by
Boryczka Andrew M
Current Estimated Value
Home Financials for this Owner
Home Financials are based on the most recent Mortgage that was taken out on this home.
Original Mortgage
$126,000
Outstanding Balance
$110,558
Interest Rate
4.6%
Mortgage Type
New Conventional
Estimated Equity
$259,512
Purchase Details
Closed on
Dec 3, 2018
Sold by
Boryczka Natalie M Est and Boryczka
Bought by
Boryczka John F
Home Financials for this Owner
Home Financials are based on the most recent Mortgage that was taken out on this home.
Original Mortgage
$126,000
Outstanding Balance
$110,558
Interest Rate
4.6%
Mortgage Type
New Conventional
Estimated Equity
$259,512
Purchase Details
Closed on
May 13, 2015
Sold by
Boryczka Natalie M and Boryczka John F
Bought by
Boryczka John F
Create a Home Valuation Report for This Property
The Home Valuation Report is an in-depth analysis detailing your home's value as well as a comparison with similar homes in the area
Home Values in the Area
Average Home Value in this Area
Purchase History
| Date | Buyer | Sale Price | Title Company |
|---|---|---|---|
| Boryczka Andrew M | $161,000 | -- | |
| Boryczka Andrew M | $161,000 | -- | |
| Boryczka John F | -- | -- | |
| Boryczka John F | -- | -- | |
| Boryczka John F | $62,000 | -- | |
| Boryczka John F | $62,000 | -- |
Source: Public Records
Mortgage History
| Date | Status | Borrower | Loan Amount |
|---|---|---|---|
| Open | Boryczka Andrew M | $126,000 | |
| Closed | Boryczka Andrew M | $126,000 |
Source: Public Records
Tax History
| Year | Tax Paid | Tax Assessment Tax Assessment Total Assessment is a certain percentage of the fair market value that is determined by local assessors to be the total taxable value of land and additions on the property. | Land | Improvement |
|---|---|---|---|---|
| 2025 | $5,091 | $291,600 | $77,400 | $214,200 |
| 2024 | $4,756 | $251,000 | $73,800 | $177,200 |
| 2023 | $4,564 | $243,300 | $73,800 | $169,500 |
| 2022 | $4,397 | $228,300 | $73,800 | $154,500 |
| 2021 | $4,185 | $217,200 | $71,000 | $146,200 |
| 2020 | $3,986 | $208,900 | $71,000 | $137,900 |
| 2019 | $3,860 | $200,100 | $71,000 | $129,100 |
| 2018 | $3,728 | $193,500 | $71,000 | $122,500 |
| 2017 | $3,709 | $193,500 | $71,000 | $122,500 |
| 2016 | $3,377 | $176,600 | $73,000 | $103,600 |
| 2015 | $3,362 | $176,600 | $73,000 | $103,600 |
Source: Public Records
Map
Nearby Homes
- 287 Whitney Ave
- 53 Farnum Dr Unit 53
- 94 Vermont St
- 337 Westfield Rd
- 286 Westfield Rd
- 147 Sheehan Dr
- 350 Homestead Ave
- 89-111 Whitney Ave
- 958 Main St
- 934 Main St
- 25-27 Elmwood Ave
- 46 Maplewood Ave
- 2027-2029 Northampton St
- 10 View St
- 36 Daley St
- 343 Chicopee St Unit 14
- 133-135 Brown Ave
- 39 State St
- 15 Maple Crest Cir Unit D
- 87 Clarendon Ave
Your Personal Tour Guide
Ask me questions while you tour the home.