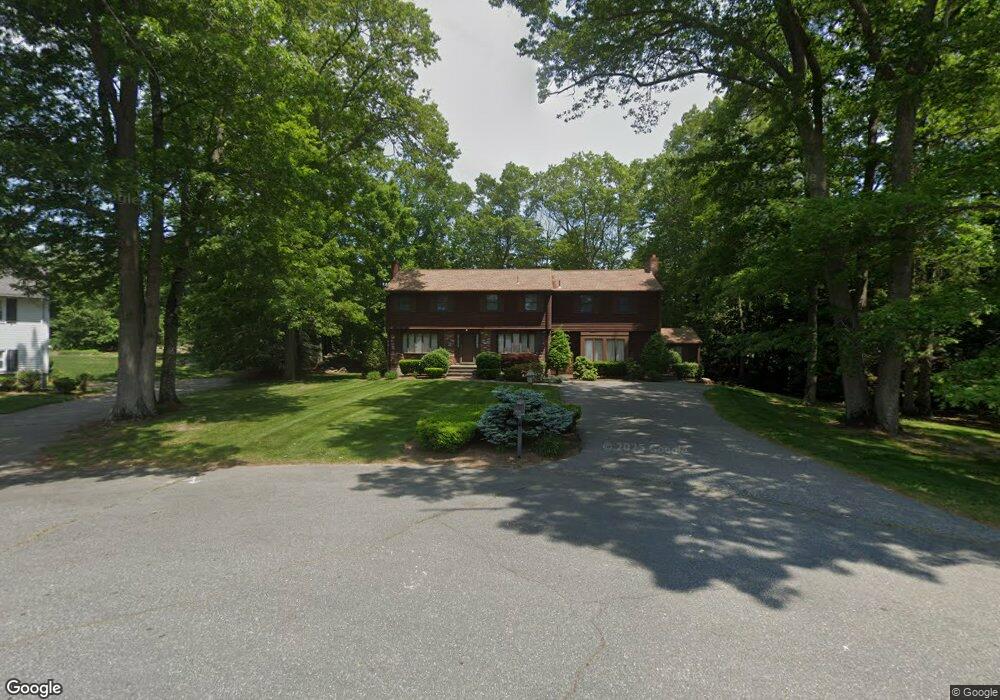
40 Mayotte Cir Brockton, MA 02301
Estimated Value: $618,000 - $876,000
3
Beds
3
Baths
3,911
Sq Ft
$194/Sq Ft
Est. Value
About This Home
This home is located at 40 Mayotte Cir, Brockton, MA 02301 and is currently estimated at $759,113, approximately $194 per square foot. 40 Mayotte Cir is a home located in Plymouth County with nearby schools including Hancock Elementary School, Manthala George Jr. School, and Louis F Angelo Elementary School.
Ownership History
Date
Name
Owned For
Owner Type
Purchase Details
Closed on
Sep 28, 1993
Sold by
Caswell Frank E and Caswell Jean F
Bought by
Wainwright William M
Current Estimated Value
Home Financials for this Owner
Home Financials are based on the most recent Mortgage that was taken out on this home.
Original Mortgage
$105,000
Interest Rate
6.83%
Create a Home Valuation Report for This Property
The Home Valuation Report is an in-depth analysis detailing your home's value as well as a comparison with similar homes in the area
Home Values in the Area
Average Home Value in this Area
Purchase History
| Date | Buyer | Sale Price | Title Company |
|---|---|---|---|
| Wainwright William M | $138,000 | -- |
Source: Public Records
Mortgage History
| Date | Status | Borrower | Loan Amount |
|---|---|---|---|
| Open | Wainwright William M | $180,000 | |
| Closed | Wainwright William M | $50,000 | |
| Closed | Wainwright William M | $105,000 |
Source: Public Records
Tax History Compared to Growth
Tax History
| Year | Tax Paid | Tax Assessment Tax Assessment Total Assessment is a certain percentage of the fair market value that is determined by local assessors to be the total taxable value of land and additions on the property. | Land | Improvement |
|---|---|---|---|---|
| 2025 | $7,376 | $609,100 | $171,100 | $438,000 |
| 2024 | $7,123 | $592,600 | $171,100 | $421,500 |
| 2023 | $7,598 | $585,400 | $137,900 | $447,500 |
| 2022 | $7,616 | $545,200 | $126,100 | $419,100 |
| 2021 | $6,815 | $470,000 | $111,600 | $358,400 |
| 2020 | $6,736 | $444,600 | $106,900 | $337,700 |
| 2019 | $6,634 | $426,900 | $98,900 | $328,000 |
| 2018 | $6,097 | $390,400 | $98,900 | $291,500 |
| 2017 | $6,864 | $378,700 | $98,900 | $279,800 |
| 2016 | $6,152 | $354,400 | $95,800 | $258,600 |
| 2015 | $5,875 | $323,700 | $95,800 | $227,900 |
| 2014 | $6,001 | $331,000 | $95,800 | $235,200 |
Source: Public Records
Map
Nearby Homes