40 Meadow Dr Hanover, MA 02339
Estimated Value: $1,036,000 - $1,467,000
4
Beds
3
Baths
3,710
Sq Ft
$329/Sq Ft
Est. Value
About This Home
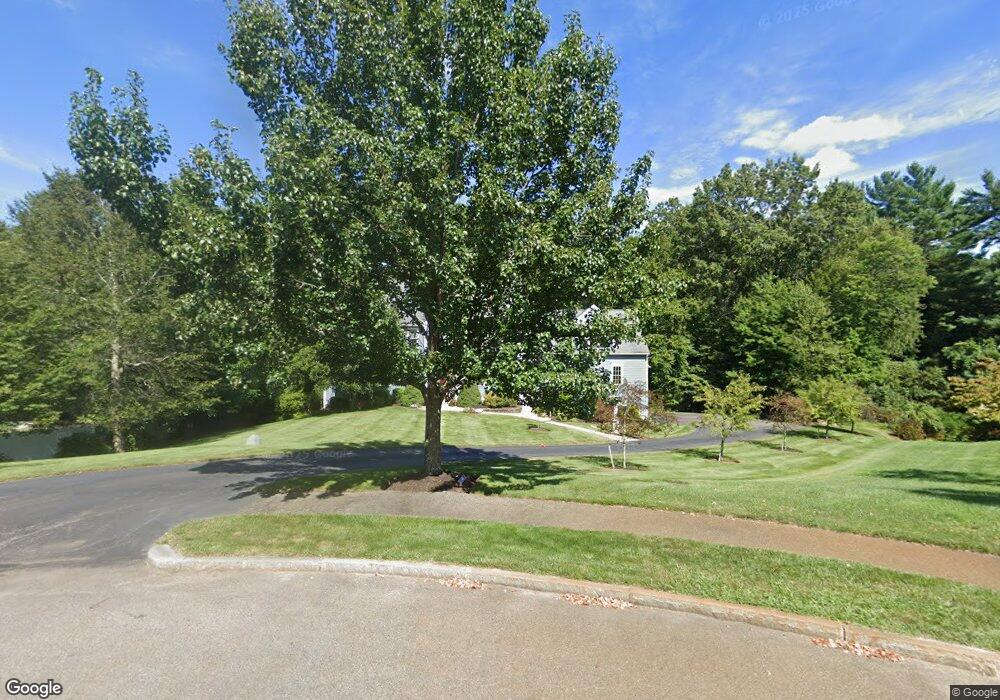
This home is located at 40 Meadow Dr, Hanover, MA 02339 and is currently estimated at $1,220,514, approximately $328 per square foot. 40 Meadow Dr is a home with nearby schools including Hanover High School, Cadence Academy Preschool - Hanover, and The Master's Academy.
Ownership History
Date
Name
Owned For
Owner Type
Purchase Details
Closed on
Apr 21, 2015
Sold by
Kmito Steven S and Kmito Rebecca S
Bought by
Steven S&R S Kmito Ret
Current Estimated Value
Purchase Details
Closed on
Apr 10, 2009
Sold by
Leonard Rt and Johnson Philip L
Bought by
Kmito Steven S and Kmito Rebecca S
Home Financials for this Owner
Home Financials are based on the most recent Mortgage that was taken out on this home.
Original Mortgage
$515,000
Interest Rate
3.25%
Mortgage Type
Adjustable Rate Mortgage/ARM
Create a Home Valuation Report for This Property
The Home Valuation Report is an in-depth analysis detailing your home's value as well as a comparison with similar homes in the area
Home Values in the Area
Average Home Value in this Area
Purchase History
| Date | Buyer | Sale Price | Title Company |
|---|---|---|---|
| Steven S&R S Kmito Ret | -- | -- | |
| Kmito Steven S | $300,172 | -- |
Source: Public Records
Mortgage History
| Date | Status | Borrower | Loan Amount |
|---|---|---|---|
| Previous Owner | Kmito Steven S | $515,000 | |
| Previous Owner | Kmito Steven S | $515,000 |
Source: Public Records
Tax History
| Year | Tax Paid | Tax Assessment Tax Assessment Total Assessment is a certain percentage of the fair market value that is determined by local assessors to be the total taxable value of land and additions on the property. | Land | Improvement |
|---|---|---|---|---|
| 2025 | $15,115 | $1,223,900 | $351,500 | $872,400 |
| 2024 | $14,613 | $1,138,100 | $351,500 | $786,600 |
| 2023 | $14,573 | $1,080,300 | $319,900 | $760,400 |
| 2022 | $13,565 | $889,500 | $281,700 | $607,800 |
| 2021 | $13,443 | $823,200 | $256,300 | $566,900 |
| 2020 | $13,391 | $821,000 | $279,500 | $541,500 |
| 2019 | $13,080 | $797,100 | $291,000 | $506,100 |
| 2018 | $12,567 | $771,900 | $311,800 | $460,100 |
| 2017 | $12,322 | $745,900 | $279,400 | $466,500 |
| 2016 | $11,971 | $710,000 | $254,100 | $455,900 |
| 2015 | $11,158 | $690,900 | $254,100 | $436,800 |
Source: Public Records
Map
Nearby Homes
- 114 Graham Hill Dr
- 51 Farmside Dr
- 35 Sproul Rd
- 339 State St
- 70 Bardin St
- 7 Farmside Dr
- 285 W Elm St
- 51 Cervelli Farm Dr
- 37 Dr
- 23 Cervelli Farm Dr
- 38 Cervelli Farm Dr
- 9 Cervelli Farm Dr
- 250 Center St
- 60 Summer Path Way
- 36 Grove St
- 430 Brook Bend Rd
- 365 Broadway
- 95 Tecumseh Dr
- 108 Waterford Dr
- 70 River Rd
Your Personal Tour Guide
Ask me questions while you tour the home.