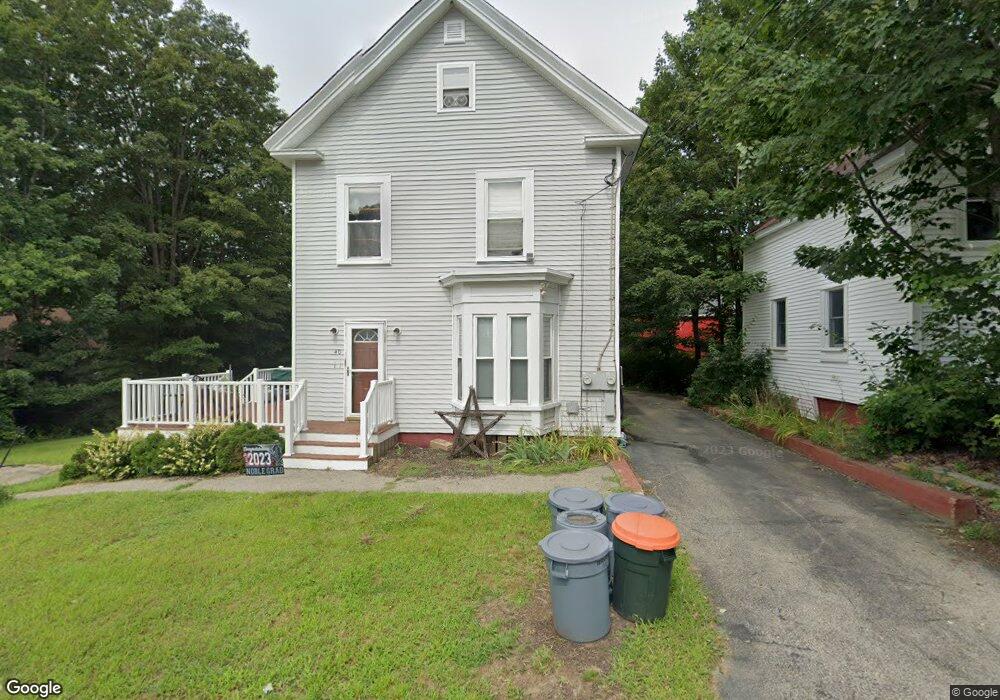
40 Merriam St Berwick, ME 03901
Estimated Value: $400,000 - $444,000
5
Beds
2
Baths
2,062
Sq Ft
$202/Sq Ft
Est. Value
About This Home
This home is located at 40 Merriam St, Berwick, ME 03901 and is currently estimated at $415,827, approximately $201 per square foot. 40 Merriam St is a home located in York County with nearby schools including Noble High School and Tri-City Christian Academy.
Ownership History
Date
Name
Owned For
Owner Type
Purchase Details
Closed on
Mar 1, 2022
Sold by
Slater Leslie M and Slater Bruce L
Bought by
Slater Leslie M
Current Estimated Value
Home Financials for this Owner
Home Financials are based on the most recent Mortgage that was taken out on this home.
Original Mortgage
$190,200
Outstanding Balance
$177,070
Interest Rate
3.92%
Mortgage Type
Purchase Money Mortgage
Estimated Equity
$238,757
Create a Home Valuation Report for This Property
The Home Valuation Report is an in-depth analysis detailing your home's value as well as a comparison with similar homes in the area
Home Values in the Area
Average Home Value in this Area
Purchase History
| Date | Buyer | Sale Price | Title Company |
|---|---|---|---|
| Slater Leslie M | -- | None Available | |
| Slater Leslie M | -- | None Available | |
| Slater Leslie M | -- | None Available |
Source: Public Records
Mortgage History
| Date | Status | Borrower | Loan Amount |
|---|---|---|---|
| Open | Slater Leslie M | $190,200 | |
| Closed | Slater Leslie M | $190,200 |
Source: Public Records
Tax History Compared to Growth
Tax History
| Year | Tax Paid | Tax Assessment Tax Assessment Total Assessment is a certain percentage of the fair market value that is determined by local assessors to be the total taxable value of land and additions on the property. | Land | Improvement |
|---|---|---|---|---|
| 2024 | $4,558 | $365,500 | $114,100 | $251,400 |
| 2023 | $4,276 | $233,400 | $81,500 | $151,900 |
| 2022 | $4,253 | $233,400 | $81,500 | $151,900 |
| 2021 | $4,271 | $233,400 | $81,500 | $151,900 |
| 2020 | $4,604 | $237,800 | $81,500 | $156,300 |
| 2019 | $4,169 | $237,800 | $81,500 | $156,300 |
| 2018 | $3,951 | $224,500 | $73,500 | $151,000 |
| 2017 | $3,850 | $224,500 | $73,500 | $151,000 |
| 2016 | $3,659 | $224,500 | $73,500 | $151,000 |
| 2014 | $3,570 | $224,500 | $73,500 | $151,000 |
| 2013 | $3,603 | $224,500 | $73,500 | $151,000 |
Source: Public Records
Map
Nearby Homes