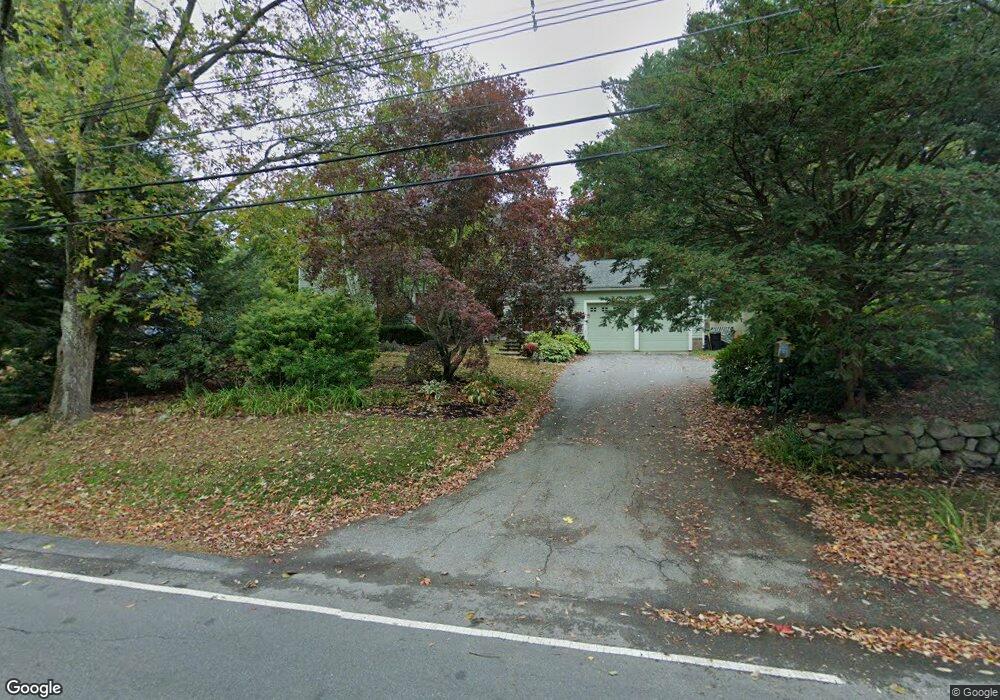
40 Milk St North Andover, MA 01845
Estimated Value: $960,643 - $1,294,000
5
Beds
3
Baths
2,836
Sq Ft
$386/Sq Ft
Est. Value
About This Home
This home is located at 40 Milk St, North Andover, MA 01845 and is currently estimated at $1,094,661, approximately $385 per square foot. 40 Milk St is a home located in Essex County with nearby schools including Franklin Elementary School, North Andover Middle School, and North Andover High School.
Ownership History
Date
Name
Owned For
Owner Type
Purchase Details
Closed on
Aug 21, 2009
Sold by
Triandiflou James A and Triandiflou Stephanie G
Bought by
Schumann Craig W and Schumann Wakako
Current Estimated Value
Home Financials for this Owner
Home Financials are based on the most recent Mortgage that was taken out on this home.
Original Mortgage
$225,000
Outstanding Balance
$146,551
Interest Rate
5.19%
Mortgage Type
Purchase Money Mortgage
Estimated Equity
$948,110
Purchase Details
Closed on
Aug 9, 2002
Sold by
Gorham Steven R and Gorham Dorothy L
Bought by
Triandiflou James A and Triandiflou Stephanie
Home Financials for this Owner
Home Financials are based on the most recent Mortgage that was taken out on this home.
Original Mortgage
$408,100
Interest Rate
6.58%
Mortgage Type
Purchase Money Mortgage
Purchase Details
Closed on
May 1, 1998
Sold by
Haigney Roger G
Bought by
Gorham Steven R
Create a Home Valuation Report for This Property
The Home Valuation Report is an in-depth analysis detailing your home's value as well as a comparison with similar homes in the area
Home Values in the Area
Average Home Value in this Area
Purchase History
| Date | Buyer | Sale Price | Title Company |
|---|---|---|---|
| Schumann Craig W | $521,000 | -- | |
| Triandiflou James A | $583,000 | -- | |
| Gorham Steven R | $400,000 | -- |
Source: Public Records
Mortgage History
| Date | Status | Borrower | Loan Amount |
|---|---|---|---|
| Open | Schumann Craig W | $225,000 | |
| Previous Owner | Gorham Steven R | $400,000 | |
| Previous Owner | Gorham Steven R | $130,000 | |
| Previous Owner | Gorham Steven R | $408,100 |
Source: Public Records
Tax History Compared to Growth
Tax History
| Year | Tax Paid | Tax Assessment Tax Assessment Total Assessment is a certain percentage of the fair market value that is determined by local assessors to be the total taxable value of land and additions on the property. | Land | Improvement |
|---|---|---|---|---|
| 2025 | $9,123 | $810,200 | $353,600 | $456,600 |
| 2024 | $8,644 | $779,400 | $335,000 | $444,400 |
| 2023 | $8,146 | $665,500 | $282,900 | $382,600 |
| 2022 | $7,927 | $585,900 | $256,800 | $329,100 |
| 2021 | $7,612 | $537,200 | $232,600 | $304,600 |
| 2020 | $7,381 | $537,200 | $232,600 | $304,600 |
| 2019 | $7,204 | $537,200 | $232,600 | $304,600 |
| 2018 | $7,806 | $537,200 | $232,600 | $304,600 |
| 2017 | $6,963 | $487,600 | $204,700 | $282,900 |
| 2016 | $6,643 | $465,500 | $206,700 | $258,800 |
| 2015 | $6,566 | $456,300 | $190,800 | $265,500 |
Source: Public Records
Map
Nearby Homes
- 479 Stevens St
- 3 Great Pond Rd
- 174 Chestnut St Unit 14
- 124 Quail Run Rd
- 136 Quail Run Rd
- 80 Sandra Ln
- 180 Chickering Rd Unit 310C
- 25 Fernview Ave Unit 8
- 23 Fernview Ave Unit 1
- 7 Kingston St
- 40 Fernview Ave Unit 11
- 19 Fernview Ave Unit 6
- 19 Fernview Ave Unit 5
- 35 Fernview Ave Unit 5
- 70 Farrwood Ave Unit 7
- 52 Fernview Ave Unit 7
- 156 Kingston St Unit 156
- 76 Hillside Rd
- 116 Mill Pond
- 115 Mill Pond