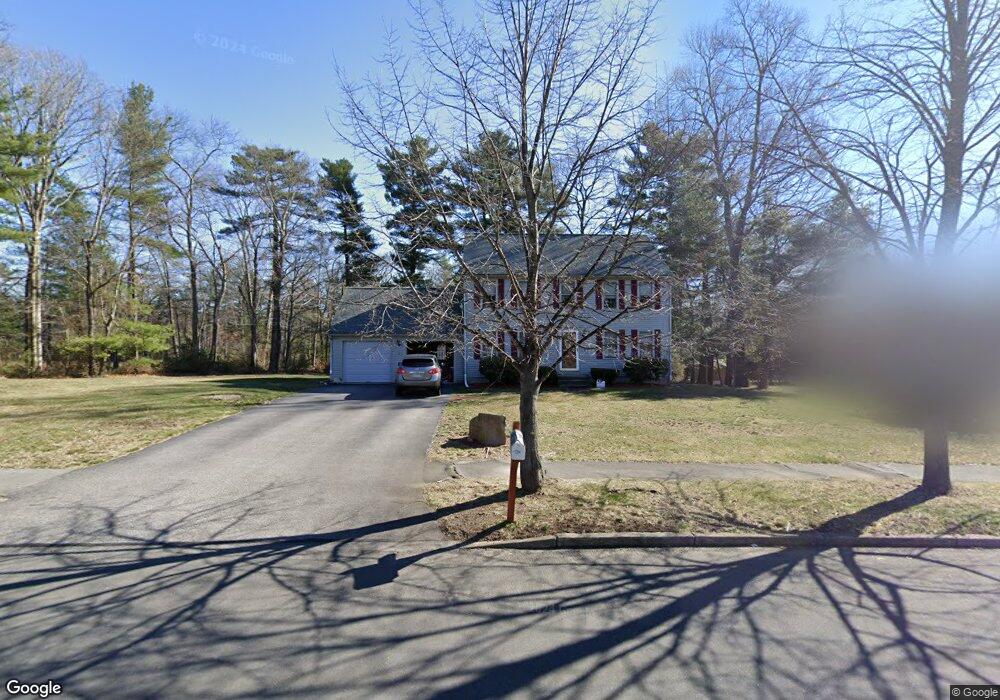
40 Millbrook Dr Rockland, MA 02370
Estimated Value: $653,956 - $754,000
3
Beds
2
Baths
1,632
Sq Ft
$429/Sq Ft
Est. Value
About This Home
This home is located at 40 Millbrook Dr, Rockland, MA 02370 and is currently estimated at $700,489, approximately $429 per square foot. 40 Millbrook Dr is a home located in Plymouth County with nearby schools including Rockland Senior High School, Calvary Chapel Academy, and St Bridget School.
Ownership History
Date
Name
Owned For
Owner Type
Purchase Details
Closed on
Feb 18, 1997
Sold by
New Eng Architectural
Bought by
Teevan Christine M and Macdonald John J
Current Estimated Value
Home Financials for this Owner
Home Financials are based on the most recent Mortgage that was taken out on this home.
Original Mortgage
$158,000
Outstanding Balance
$17,926
Interest Rate
7.6%
Mortgage Type
Purchase Money Mortgage
Estimated Equity
$682,563
Create a Home Valuation Report for This Property
The Home Valuation Report is an in-depth analysis detailing your home's value as well as a comparison with similar homes in the area
Home Values in the Area
Average Home Value in this Area
Purchase History
| Date | Buyer | Sale Price | Title Company |
|---|---|---|---|
| Teevan Christine M | $178,269 | -- |
Source: Public Records
Mortgage History
| Date | Status | Borrower | Loan Amount |
|---|---|---|---|
| Open | Teevan Christine M | $40,000 | |
| Open | Teevan Christine M | $158,000 |
Source: Public Records
Tax History
| Year | Tax Paid | Tax Assessment Tax Assessment Total Assessment is a certain percentage of the fair market value that is determined by local assessors to be the total taxable value of land and additions on the property. | Land | Improvement |
|---|---|---|---|---|
| 2025 | $8,235 | $602,400 | $241,800 | $360,600 |
| 2024 | $7,995 | $568,600 | $228,100 | $340,500 |
| 2023 | $8,153 | $535,700 | $219,200 | $316,500 |
| 2022 | $7,811 | $466,300 | $190,600 | $275,700 |
| 2021 | $7,474 | $432,500 | $181,100 | $251,400 |
| 2020 | $7,259 | $414,800 | $172,500 | $242,300 |
| 2019 | $7,087 | $395,500 | $164,300 | $231,200 |
| 2018 | $7,099 | $389,600 | $185,700 | $203,900 |
| 2017 | $6,945 | $375,800 | $185,700 | $190,100 |
| 2016 | $6,725 | $363,700 | $178,600 | $185,100 |
| 2015 | $6,417 | $337,200 | $166,900 | $170,300 |
| 2014 | $6,100 | $332,600 | $163,700 | $168,900 |
Source: Public Records
Map
Nearby Homes
- 10 Birch Bottom Cir
- 12 Reed Bent Rd
- 5 Alpine St
- 7 Hayford Trail Unit 12
- 5 Hayford Trail Unit 11
- 17 Hayford Trail Unit 12
- 22 Howland Trail Unit 34
- 10 Proud Foot Way
- 41 Winter Cir
- 724 Whitman St
- 643 Summer St
- 170 Pleasant St
- 810 Brookline Way
- 214 Winter St
- 696 Summer St
- 74 Benson St
- 291 Raynor Ave
- 608 Plymouth St
- 191 Summer St
- 5 Pat Rose Way
- 42 Millbrook Dr
- 41 Morningside Dr
- 43 Morningside Dr
- 44 Millbrook Dr
- 43 Millbrook Dr
- 41 Millbrook Dr
- 45 Morningside Dr
- 45 Millbrook Dr
- 39 Millbrook Dr
- 37 Millbrook Dr
- 46 Millbrook Dr
- 47 Morningside Dr
- 47 Millbrook Dr
- 40 Morningside Dr
- 42 Morningside Dr
- 38 Morningside Dr
- 49 Morningside Dr
- 44 Morningside Dr
- 48 Millbrook Dr
- 49 Millbrook Dr
Your Personal Tour Guide
Ask me questions while you tour the home.