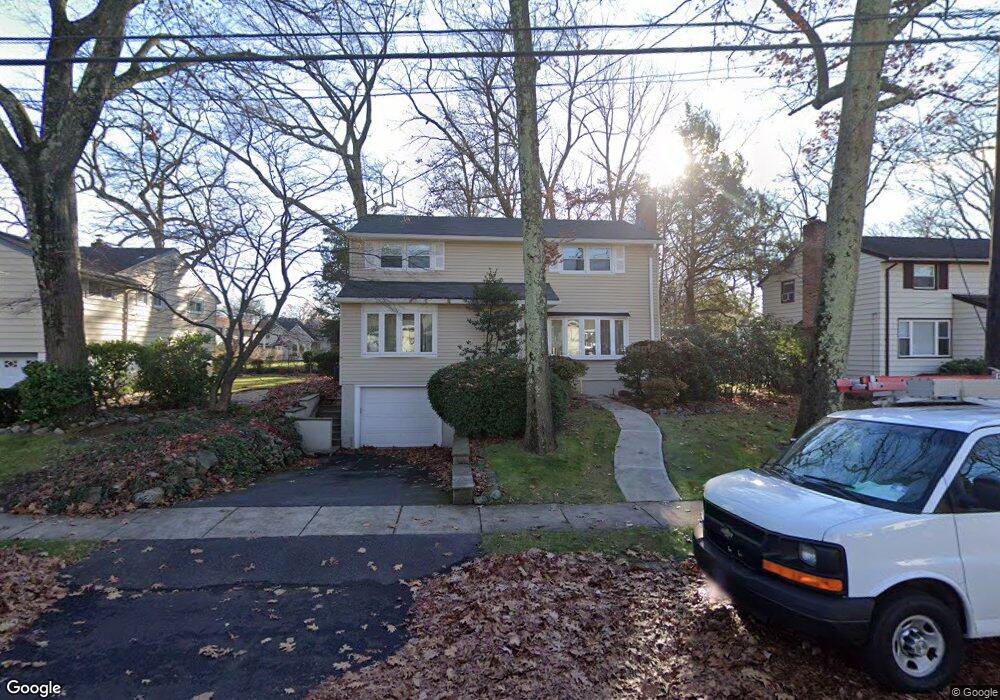
40 Moore Ave Waldwick, NJ 07463
Estimated Value: $698,000 - $842,000
4
Beds
2
Baths
1,895
Sq Ft
$395/Sq Ft
Est. Value
About This Home
This home is located at 40 Moore Ave, Waldwick, NJ 07463 and is currently estimated at $749,215, approximately $395 per square foot. 40 Moore Ave is a home located in Bergen County with nearby schools including Waldwick High School, Waldwick Seventh-Day Adventist School, and The Forum School.
Ownership History
Date
Name
Owned For
Owner Type
Purchase Details
Closed on
Nov 11, 2020
Sold by
Marino David N and Marino Maureen A
Bought by
Espino Stephanie
Current Estimated Value
Home Financials for this Owner
Home Financials are based on the most recent Mortgage that was taken out on this home.
Original Mortgage
$490,943
Interest Rate
2.71%
Mortgage Type
FHA
Create a Home Valuation Report for This Property
The Home Valuation Report is an in-depth analysis detailing your home's value as well as a comparison with similar homes in the area
Home Values in the Area
Average Home Value in this Area
Purchase History
| Date | Buyer | Sale Price | Title Company |
|---|---|---|---|
| Espino Stephanie | $500,000 | Riverview Title Agency Llc |
Source: Public Records
Mortgage History
| Date | Status | Borrower | Loan Amount |
|---|---|---|---|
| Previous Owner | Espino Stephanie | $490,943 |
Source: Public Records
Tax History
| Year | Tax Paid | Tax Assessment Tax Assessment Total Assessment is a certain percentage of the fair market value that is determined by local assessors to be the total taxable value of land and additions on the property. | Land | Improvement |
|---|---|---|---|---|
| 2025 | $14,353 | $618,200 | $350,100 | $268,100 |
| 2024 | $13,386 | $648,300 | $350,100 | $298,200 |
| 2023 | $13,109 | $460,300 | $282,300 | $178,000 |
| 2022 | $13,109 | $460,300 | $282,300 | $178,000 |
| 2021 | $12,861 | $460,300 | $282,300 | $178,000 |
| 2020 | $12,737 | $460,300 | $282,300 | $178,000 |
| 2019 | $12,732 | $460,300 | $282,300 | $178,000 |
| 2018 | $12,331 | $460,300 | $282,300 | $178,000 |
| 2017 | $12,226 | $460,300 | $282,300 | $178,000 |
| 2016 | $11,842 | $455,100 | $282,300 | $172,800 |
| 2015 | $11,705 | $455,100 | $282,300 | $172,800 |
| 2014 | $11,423 | $455,100 | $282,300 | $172,800 |
Source: Public Records
Map
Nearby Homes
- 39 1 & 2 Smith
- 5 Everson Dr
- 4 Everson Dr
- 3 Everson Dr
- 2 Everson Dr
- 103 Highwood Ave
- 101 Highwood Ave
- 34 Zazzetti St
- 31 Smith St
- 20 Zazzetti St Unit 1
- 10 W Prospect St
- 33 Homewood Ave
- 1 Smith St
- 96 Grove St
- 6 Burning Hollow Rd
- 1002 Whitney Ln
- 12 Maple Ave
- 8 Adams Rd
- 2 Maple Ave
- 4-2 Vernon Ct Unit 4-2
Your Personal Tour Guide
Ask me questions while you tour the home.