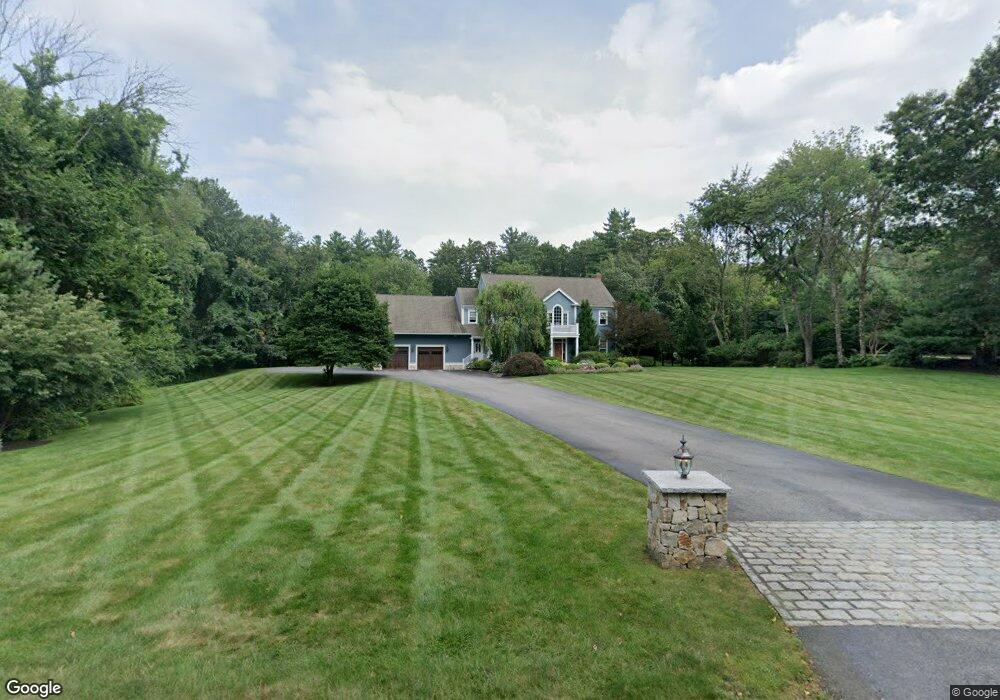
40 Moore Ln Northborough, MA 01532
Estimated Value: $1,212,000 - $1,669,000
4
Beds
4
Baths
4,287
Sq Ft
$324/Sq Ft
Est. Value
About This Home
This home is located at 40 Moore Ln, Northborough, MA 01532 and is currently estimated at $1,389,127, approximately $324 per square foot. 40 Moore Ln is a home located in Worcester County with nearby schools including Lincoln Street Elementary School, Robert E. Melican Middle School, and Algonquin Regional High School.
Ownership History
Date
Name
Owned For
Owner Type
Purchase Details
Closed on
Jun 12, 2019
Sold by
Platzman Melissa S
Bought by
Melissa S Platzman Rt
Current Estimated Value
Purchase Details
Closed on
Feb 28, 2018
Sold by
Platzman 2001 Rt
Bought by
Platzman Melissa S
Purchase Details
Closed on
Jul 9, 1998
Sold by
Rodgers Frank R and Rodgers Gillian A
Bought by
Platzman Bruce and Platzman Melissa S
Home Financials for this Owner
Home Financials are based on the most recent Mortgage that was taken out on this home.
Original Mortgage
$345,000
Interest Rate
7.02%
Mortgage Type
Purchase Money Mortgage
Purchase Details
Closed on
Sep 3, 1991
Sold by
Wellnorth Rt
Bought by
Rodgers Frank R
Create a Home Valuation Report for This Property
The Home Valuation Report is an in-depth analysis detailing your home's value as well as a comparison with similar homes in the area
Home Values in the Area
Average Home Value in this Area
Purchase History
| Date | Buyer | Sale Price | Title Company |
|---|---|---|---|
| Melissa S Platzman Rt | -- | -- | |
| Platzman Melissa S | -- | -- | |
| Platzman Bruce | $445,000 | -- | |
| Rodgers Frank R | $308,300 | -- |
Source: Public Records
Mortgage History
| Date | Status | Borrower | Loan Amount |
|---|---|---|---|
| Previous Owner | Rodgers Frank R | $500,000 | |
| Previous Owner | Rodgers Frank R | $345,000 |
Source: Public Records
Tax History Compared to Growth
Tax History
| Year | Tax Paid | Tax Assessment Tax Assessment Total Assessment is a certain percentage of the fair market value that is determined by local assessors to be the total taxable value of land and additions on the property. | Land | Improvement |
|---|---|---|---|---|
| 2025 | $19,292 | $1,353,800 | $334,400 | $1,019,400 |
| 2024 | $17,474 | $1,223,700 | $264,400 | $959,300 |
| 2023 | $16,500 | $1,115,600 | $250,000 | $865,600 |
| 2022 | $15,431 | $935,800 | $238,800 | $697,000 |
| 2021 | $14,982 | $875,100 | $218,400 | $656,700 |
| 2020 | $15,233 | $883,100 | $206,800 | $676,300 |
| 2019 | $14,811 | $863,600 | $201,100 | $662,500 |
| 2018 | $15,604 | $897,300 | $205,400 | $691,900 |
| 2017 | $15,081 | $867,200 | $205,400 | $661,800 |
| 2016 | $14,859 | $865,400 | $201,400 | $664,000 |
| 2015 | $15,157 | $906,000 | $216,100 | $689,900 |
| 2014 | $14,398 | $867,900 | $216,100 | $651,800 |
Source: Public Records
Map
Nearby Homes