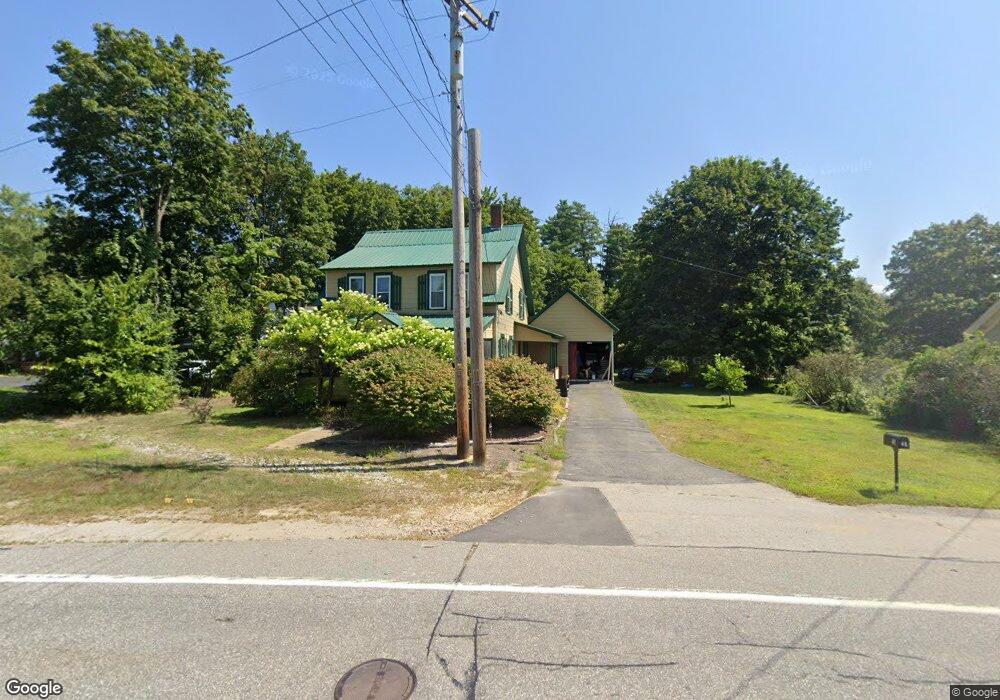
40 Mountain Rd Concord, NH 03301
East Concord NeighborhoodEstimated Value: $377,000 - $410,000
3
Beds
2
Baths
1,403
Sq Ft
$279/Sq Ft
Est. Value
About This Home
This home is located at 40 Mountain Rd, Concord, NH 03301 and is currently estimated at $390,925, approximately $278 per square foot. 40 Mountain Rd is a home located in Merrimack County with nearby schools including Broken Ground School, Rundlett Middle School, and Concord High School.
Ownership History
Date
Name
Owned For
Owner Type
Purchase Details
Closed on
Aug 8, 2003
Sold by
Sanborn Judith
Bought by
Sanborn John
Current Estimated Value
Home Financials for this Owner
Home Financials are based on the most recent Mortgage that was taken out on this home.
Original Mortgage
$98,000
Interest Rate
5.28%
Mortgage Type
Purchase Money Mortgage
Create a Home Valuation Report for This Property
The Home Valuation Report is an in-depth analysis detailing your home's value as well as a comparison with similar homes in the area
Home Values in the Area
Average Home Value in this Area
Purchase History
| Date | Buyer | Sale Price | Title Company |
|---|---|---|---|
| Sanborn John | $135,000 | -- |
Source: Public Records
Mortgage History
| Date | Status | Borrower | Loan Amount |
|---|---|---|---|
| Open | Sanborn John | $127,000 | |
| Closed | Sanborn John | $27,000 | |
| Closed | Sanborn John | $98,000 |
Source: Public Records
Tax History
| Year | Tax Paid | Tax Assessment Tax Assessment Total Assessment is a certain percentage of the fair market value that is determined by local assessors to be the total taxable value of land and additions on the property. | Land | Improvement |
|---|---|---|---|---|
| 2025 | $6,829 | $234,600 | $154,400 | $80,200 |
| 2024 | $6,496 | $234,600 | $154,400 | $80,200 |
| 2023 | $6,301 | $234,600 | $154,400 | $80,200 |
| 2022 | $6,074 | $234,600 | $154,400 | $80,200 |
| 2021 | $6,270 | $249,600 | $154,400 | $95,200 |
| 2020 | $5,130 | $191,700 | $95,400 | $96,300 |
| 2019 | $4,995 | $179,800 | $96,200 | $83,600 |
| 2018 | $5,043 | $178,900 | $96,200 | $82,700 |
| 2017 | $4,764 | $168,700 | $92,100 | $76,600 |
| 2016 | $4,618 | $166,900 | $92,100 | $74,800 |
| 2015 | $4,391 | $160,600 | $92,100 | $68,500 |
| 2014 | $4,306 | $160,600 | $92,100 | $68,500 |
| 2013 | $4,108 | $160,600 | $92,100 | $68,500 |
| 2012 | $3,958 | $162,400 | $87,800 | $74,600 |
Source: Public Records
Map
Nearby Homes
- 61 Mountain Rd
- 17 Shawmut St
- 216 E Side Dr
- 24 Foxcross Cir
- 17 Callaway Dr Unit 1
- 17 Callaway Dr Unit 5
- 35 Callaway Dr Unit 6
- 34 Callaway Dr Unit 4
- 34 Callaway Dr Unit 1
- 362 N State St
- 441, 443 N State St
- 4 K St
- 62 Hampton St
- 169 Portsmouth St Unit 14
- 95 E Side Dr
- 14 Knight St Unit 2
- 13-15 Walker St
- 19 Grappone Dr
- 563 Mountain Rd
- 28 Stevens Dr
Your Personal Tour Guide
Ask me questions while you tour the home.