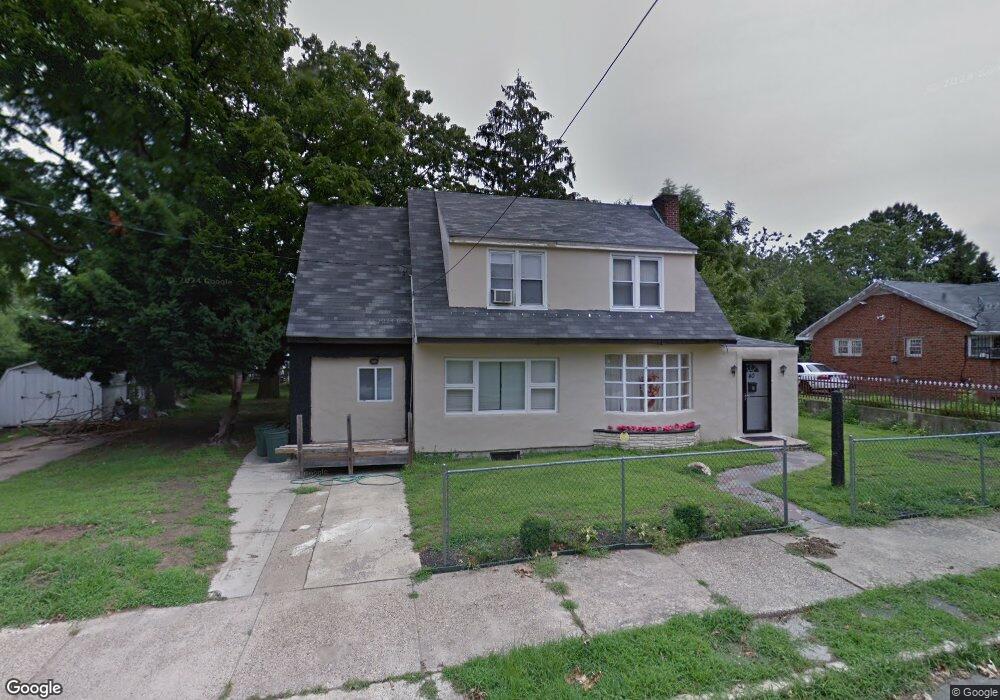
40 N 32nd St Camden, NJ 08105
Dudley NeighborhoodEstimated Value: $226,588 - $297,000
--
Bed
--
Bath
2,091
Sq Ft
$125/Sq Ft
Est. Value
About This Home
This home is located at 40 N 32nd St, Camden, NJ 08105 and is currently estimated at $262,397, approximately $125 per square foot. 40 N 32nd St is a home located in Camden County with nearby schools including Eastside High School, Camden Forward School, and St Joseph Pro-Cathedral School.
Ownership History
Date
Name
Owned For
Owner Type
Purchase Details
Closed on
Jun 30, 2008
Sold by
Thompson Ronnie A and Jtwros Troy L Morris
Bought by
Roy Shawn
Current Estimated Value
Home Financials for this Owner
Home Financials are based on the most recent Mortgage that was taken out on this home.
Original Mortgage
$108,750
Outstanding Balance
$70,371
Interest Rate
6.13%
Mortgage Type
New Conventional
Estimated Equity
$192,026
Create a Home Valuation Report for This Property
The Home Valuation Report is an in-depth analysis detailing your home's value as well as a comparison with similar homes in the area
Home Values in the Area
Average Home Value in this Area
Purchase History
| Date | Buyer | Sale Price | Title Company |
|---|---|---|---|
| Roy Shawn | $145,000 | -- |
Source: Public Records
Mortgage History
| Date | Status | Borrower | Loan Amount |
|---|---|---|---|
| Open | Roy Shawn | $108,750 |
Source: Public Records
Tax History Compared to Growth
Tax History
| Year | Tax Paid | Tax Assessment Tax Assessment Total Assessment is a certain percentage of the fair market value that is determined by local assessors to be the total taxable value of land and additions on the property. | Land | Improvement |
|---|---|---|---|---|
| 2025 | $5,155 | $145,500 | $47,200 | $98,300 |
| 2024 | $4,983 | $145,500 | $47,200 | $98,300 |
| 2023 | $4,983 | $145,500 | $47,200 | $98,300 |
| 2022 | $4,890 | $145,500 | $47,200 | $98,300 |
| 2021 | $4,873 | $145,500 | $47,200 | $98,300 |
| 2020 | $4,627 | $145,500 | $47,200 | $98,300 |
| 2019 | $4,430 | $145,500 | $47,200 | $98,300 |
| 2018 | $4,407 | $145,500 | $47,200 | $98,300 |
| 2017 | $4,300 | $145,500 | $47,200 | $98,300 |
| 2016 | $4,163 | $145,500 | $47,200 | $98,300 |
| 2015 | $4,007 | $145,500 | $47,200 | $98,300 |
| 2014 | $3,911 | $145,500 | $47,200 | $98,300 |
Source: Public Records
Map
Nearby Homes
- 106 N 34th St
- 127 N 33rd St
- 3170 Merriel Ave
- 113 S 32nd St
- 3619 Fremont Ave
- 3075 Stevens St
- 224 S 32nd St
- 226 Wilmot Ave
- 3609 Westfield Ave
- 2937 Carman St
- 420 N 36th St
- 4616 Woodland Ave
- 2934 Cramer St
- 2240 40th St
- 243 N 40th St
- 3733 Drexel Ave
- 3027 Morrison St
- 363 Garden Ave
- 2817 Westfield Ave
- 419 Garden Ave