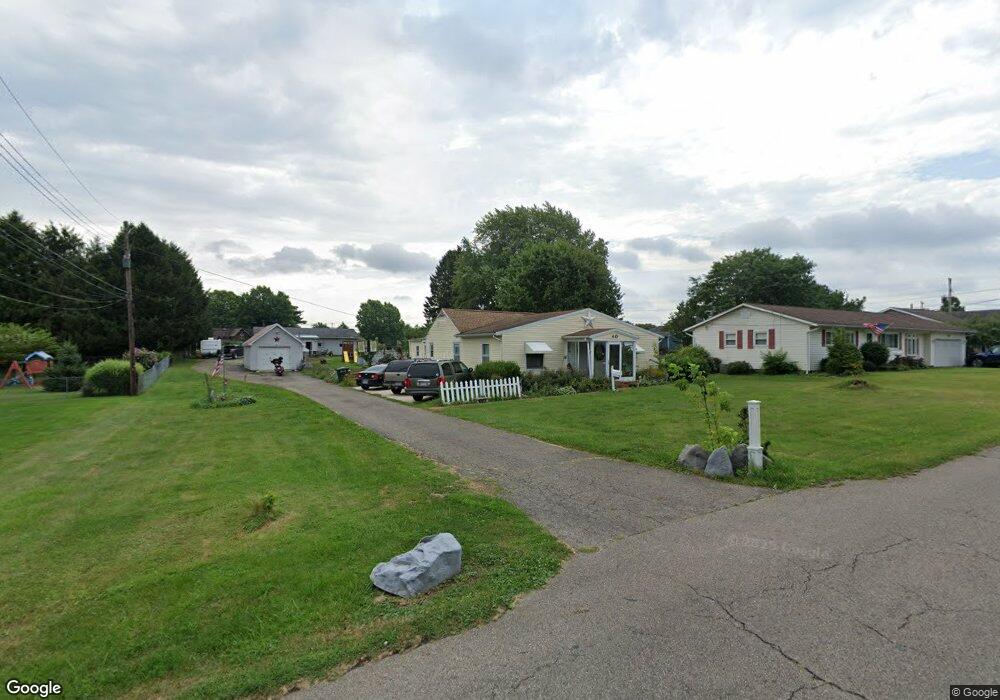
40 N 39th St Newark, OH 43055
Estimated Value: $225,000 - $290,721
2
Beds
1
Bath
1,404
Sq Ft
$182/Sq Ft
Est. Value
About This Home
This home is located at 40 N 39th St, Newark, OH 43055 and is currently estimated at $254,930, approximately $181 per square foot. 40 N 39th St is a home located in Licking County with nearby schools including Cherry Valley Elementary School, Wilson Middle School, and Newark High School.
Ownership History
Date
Name
Owned For
Owner Type
Purchase Details
Closed on
Sep 23, 2011
Sold by
Ferrell Dallas B and Ferrell Donna K
Bought by
Witgens Shelly L
Current Estimated Value
Purchase Details
Closed on
Oct 19, 2007
Sold by
Hud
Bought by
Ferrell Dallas
Home Financials for this Owner
Home Financials are based on the most recent Mortgage that was taken out on this home.
Original Mortgage
$84,000
Interest Rate
6.38%
Mortgage Type
Unknown
Purchase Details
Closed on
Aug 25, 2006
Sold by
Nethers William J and Jordan Laura A
Bought by
Hud
Purchase Details
Closed on
May 30, 1996
Sold by
Armentrout Viola B
Bought by
Nethers William J and Jordon Laura A
Home Financials for this Owner
Home Financials are based on the most recent Mortgage that was taken out on this home.
Original Mortgage
$78,221
Interest Rate
7.99%
Mortgage Type
FHA
Create a Home Valuation Report for This Property
The Home Valuation Report is an in-depth analysis detailing your home's value as well as a comparison with similar homes in the area
Home Values in the Area
Average Home Value in this Area
Purchase History
| Date | Buyer | Sale Price | Title Company |
|---|---|---|---|
| Witgens Shelly L | -- | Attorney | |
| Ferrell Dallas | $82,000 | Lakeside T | |
| Hud | $66,000 | None Available | |
| Nethers William J | $80,000 | -- |
Source: Public Records
Mortgage History
| Date | Status | Borrower | Loan Amount |
|---|---|---|---|
| Previous Owner | Ferrell Dallas | $84,000 | |
| Previous Owner | Nethers William J | $78,221 |
Source: Public Records
Tax History Compared to Growth
Tax History
| Year | Tax Paid | Tax Assessment Tax Assessment Total Assessment is a certain percentage of the fair market value that is determined by local assessors to be the total taxable value of land and additions on the property. | Land | Improvement |
|---|---|---|---|---|
| 2024 | $2,951 | $81,800 | $26,920 | $54,880 |
| 2023 | $2,945 | $81,800 | $26,920 | $54,880 |
| 2022 | $2,458 | $60,730 | $15,370 | $45,360 |
| 2021 | $2,579 | $60,730 | $15,370 | $45,360 |
| 2020 | $2,637 | $60,730 | $15,370 | $45,360 |
| 2019 | $2,397 | $53,170 | $15,370 | $37,800 |
| 2018 | $2,398 | $0 | $0 | $0 |
| 2017 | $1,979 | $0 | $0 | $0 |
| 2016 | $1,625 | $0 | $0 | $0 |
| 2015 | $1,661 | $0 | $0 | $0 |
| 2014 | $2,102 | $0 | $0 | $0 |
| 2013 | $1,574 | $0 | $0 | $0 |
Source: Public Records
Map
Nearby Homes
- 68 Stonington Cir
- 25 Stone House Ct
- 36 Stonington Cir
- 53 Stone House Ct
- 52 Stone House Ct
- 132 Stonington Place Unit 132
- 1857 Cherry Valley Rd
- 1812 Cherrywood Dr
- 189 N Westmoor Ave
- 163 Badger
- Lyndhurst Plan at The Overlook
- Stamford Plan at The Overlook
- Aldridge Plan at The Overlook
- Fairton Plan at The Overlook
- Bellamy Plan at The Overlook
- Pendleton Plan at The Overlook
- Henley Plan at The Overlook
- Newcastle Plan at The Overlook
- Harmony Plan at The Overlook
- 235 Cynthia St