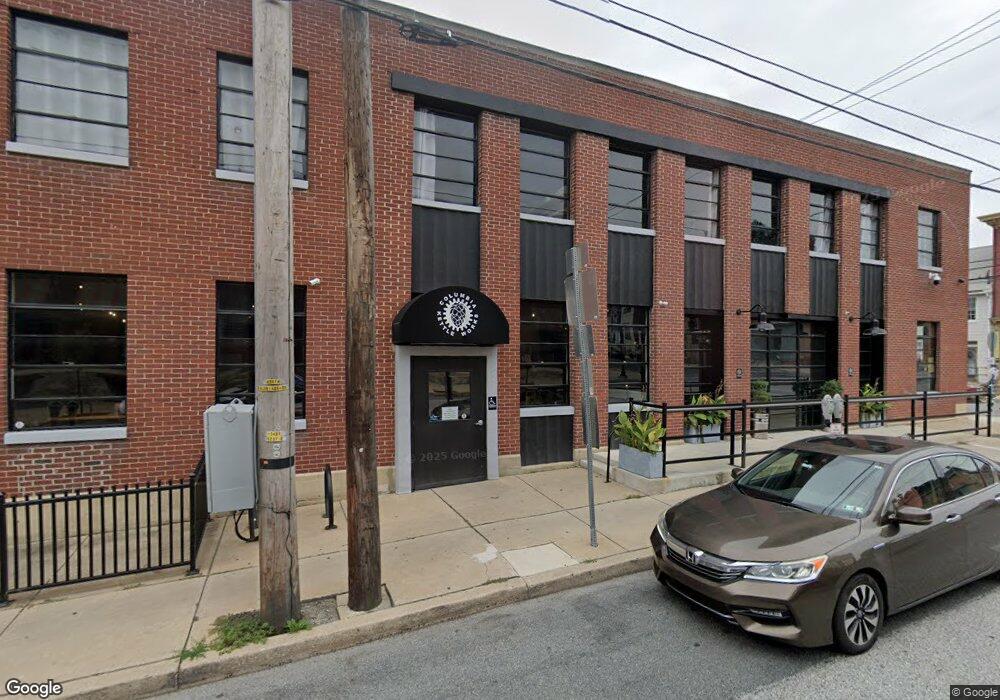
40 N 3rd St Columbia, PA 17512
Estimated Value: $257,000
Studio
--
Bath
20,000
Sq Ft
$13/Sq Ft
Est. Value
About This Home
This home is located at 40 N 3rd St, Columbia, PA 17512 and is currently estimated at $257,000, approximately $12 per square foot. 40 N 3rd St is a home located in Lancaster County with nearby schools including Columbia Middle School and Columbia High School.
Ownership History
Date
Name
Owned For
Owner Type
Purchase Details
Closed on
Jul 15, 2016
Sold by
Columbia Llc
Bought by
Aberrant Investments Llc
Current Estimated Value
Home Financials for this Owner
Home Financials are based on the most recent Mortgage that was taken out on this home.
Original Mortgage
$650,000
Outstanding Balance
$520,230
Interest Rate
3.66%
Mortgage Type
Seller Take Back
Estimated Equity
-$263,230
Purchase Details
Closed on
Oct 22, 2014
Bought by
Columbia Llc
Purchase Details
Closed on
Feb 25, 2009
Sold by
Doolittle David A
Bought by
Doolittle M Suzanne
Purchase Details
Closed on
Jul 18, 2008
Sold by
United Telephone Co Of Pennsylvania Llc
Bought by
Doolittle Investments Llc
Home Financials for this Owner
Home Financials are based on the most recent Mortgage that was taken out on this home.
Original Mortgage
$274,857
Interest Rate
6.49%
Mortgage Type
Commercial
Create a Home Valuation Report for This Property
The Home Valuation Report is an in-depth analysis detailing your home's value as well as a comparison with similar homes in the area
Home Values in the Area
Average Home Value in this Area
Purchase History
| Date | Buyer | Sale Price | Title Company |
|---|---|---|---|
| Aberrant Investments Llc | $750,000 | Attorney | |
| Columbia Llc | $450,000 | -- | |
| Doolittle M Suzanne | -- | None Available | |
| Doolittle David A | -- | None Available | |
| Doolittle Investments Llc | $75,000 | None Available |
Source: Public Records
Mortgage History
| Date | Status | Borrower | Loan Amount |
|---|---|---|---|
| Open | Aberrant Investments Llc | $650,000 | |
| Previous Owner | Doolittle Investments Llc | $274,857 |
Source: Public Records
Tax History
| Year | Tax Paid | Tax Assessment Tax Assessment Total Assessment is a certain percentage of the fair market value that is determined by local assessors to be the total taxable value of land and additions on the property. | Land | Improvement |
|---|---|---|---|---|
| 2025 | $10,068 | $269,400 | $53,300 | $216,100 |
| 2024 | $10,068 | $269,400 | $53,300 | $216,100 |
| 2023 | $10,068 | $269,400 | $53,300 | $216,100 |
| 2022 | $10,068 | $269,400 | $53,300 | $216,100 |
| 2021 | $10,068 | $269,400 | $53,300 | $216,100 |
| 2020 | $10,068 | $269,400 | $53,300 | $216,100 |
| 2019 | $9,894 | $269,400 | $53,300 | $216,100 |
| 2018 | $6,955 | $269,400 | $53,300 | $216,100 |
| 2017 | $8,260 | $201,100 | $21,000 | $180,100 |
| 2016 | $8,260 | $201,100 | $21,000 | $180,100 |
| 2015 | $2,360 | $201,100 | $21,000 | $180,100 |
| 2014 | $5,671 | $56,000 | $21,000 | $35,000 |
Source: Public Records
Map
Nearby Homes
Your Personal Tour Guide
Ask me questions while you tour the home.