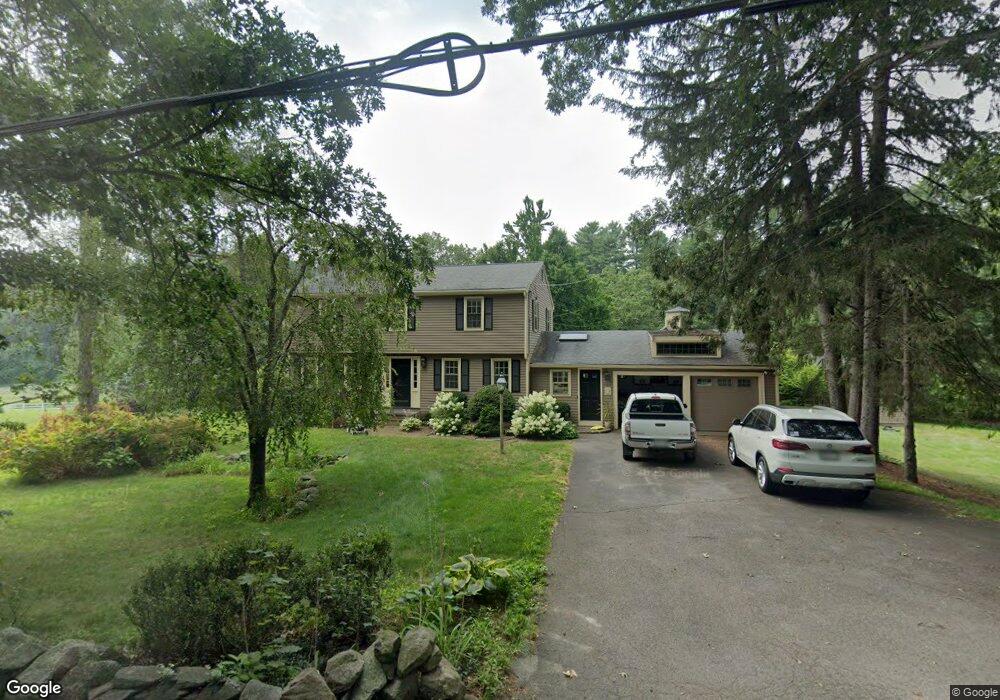
40 Nixon Rd Framingham, MA 01701
Estimated Value: $966,000 - $1,087,011
4
Beds
3
Baths
2,882
Sq Ft
$362/Sq Ft
Est. Value
About This Home
This home is located at 40 Nixon Rd, Framingham, MA 01701 and is currently estimated at $1,044,003, approximately $362 per square foot. 40 Nixon Rd is a home located in Middlesex County with nearby schools including Framingham High School, Sudbury Valley School, and Summit Montessori School.
Ownership History
Date
Name
Owned For
Owner Type
Purchase Details
Closed on
May 26, 2017
Sold by
Kimball Kevin A and Kimball Lindsay G
Bought by
Kimball 2017 Funding T
Current Estimated Value
Purchase Details
Closed on
Dec 23, 1980
Bought by
Kimball Kevin A and Kimball Lindsay G
Create a Home Valuation Report for This Property
The Home Valuation Report is an in-depth analysis detailing your home's value as well as a comparison with similar homes in the area
Home Values in the Area
Average Home Value in this Area
Purchase History
| Date | Buyer | Sale Price | Title Company |
|---|---|---|---|
| Kimball 2017 Funding T | -- | -- | |
| Kimball Kevin A | -- | -- |
Source: Public Records
Mortgage History
| Date | Status | Borrower | Loan Amount |
|---|---|---|---|
| Previous Owner | Kimball Kevin A | $300,000 | |
| Previous Owner | Kimball Kevin A | $150,000 | |
| Previous Owner | Kimball Kevin A | $175,000 |
Source: Public Records
Tax History Compared to Growth
Tax History
| Year | Tax Paid | Tax Assessment Tax Assessment Total Assessment is a certain percentage of the fair market value that is determined by local assessors to be the total taxable value of land and additions on the property. | Land | Improvement |
|---|---|---|---|---|
| 2025 | $12,047 | $1,009,000 | $342,600 | $666,400 |
| 2024 | $11,903 | $955,300 | $304,900 | $650,400 |
| 2023 | $11,336 | $866,000 | $281,000 | $585,000 |
| 2022 | $10,830 | $788,200 | $255,300 | $532,900 |
| 2021 | $10,502 | $747,500 | $245,200 | $502,300 |
| 2020 | $10,636 | $710,000 | $223,000 | $487,000 |
| 2019 | $10,368 | $674,100 | $212,600 | $461,500 |
| 2018 | $10,304 | $631,400 | $208,200 | $423,200 |
| 2017 | $10,121 | $605,700 | $202,100 | $403,600 |
| 2016 | $10,464 | $602,100 | $210,000 | $392,100 |
| 2015 | $10,255 | $575,500 | $210,000 | $365,500 |
Source: Public Records
Map
Nearby Homes
- 1011 Edmands Rd
- 100 Parmenter Rd
- 6 Parmenter Rd
- 111 Hager St
- 177A Edmands Rd
- 620 Edmands Rd
- 100 Nobscot Dr
- 6 Mountain View Dr
- 1060 Grove St Unit 23
- 1060 Grove St Unit 31
- 1060 Grove St Unit 21
- 1060 Grove St Unit 42
- 1060 Grove St Unit 43
- 1060 Grove St Unit Lot 39
- 1060 Grove St Unit 41
- 495 Edmands Rd
- 28 Garvey Rd
- 11 Azalea Ln
- 31 Sonia Dr
- 3 Leo Chasse Way