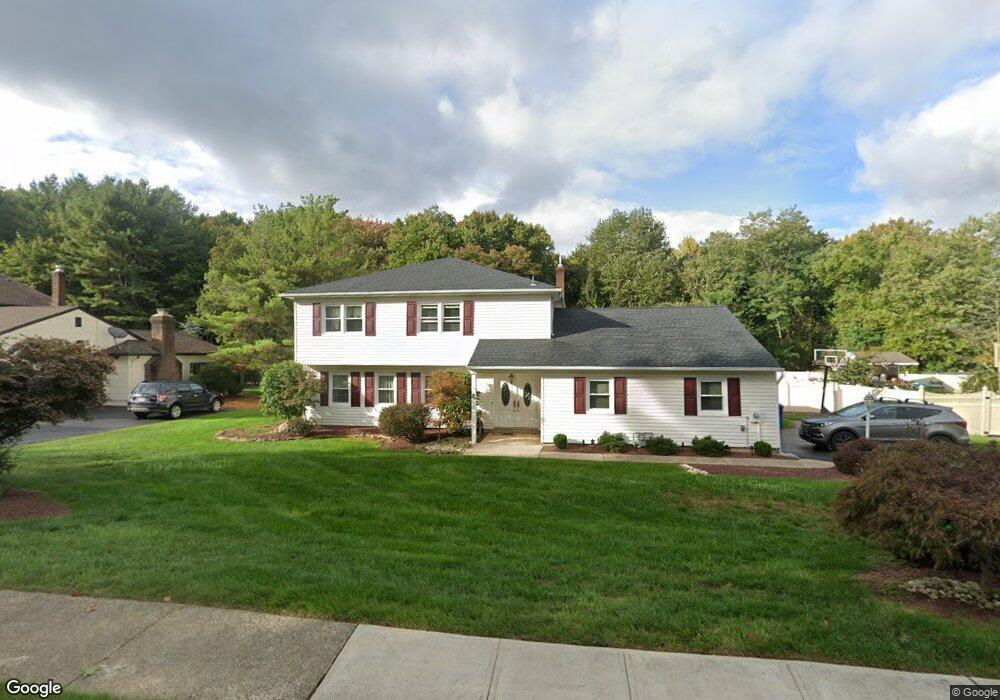
40 Nolan Rd Morganville, NJ 07751
Estimated Value: $637,000 - $953,000
4
Beds
3
Baths
2,128
Sq Ft
$369/Sq Ft
Est. Value
About This Home
This home is located at 40 Nolan Rd, Morganville, NJ 07751 and is currently estimated at $784,948, approximately $368 per square foot. 40 Nolan Rd is a home located in Monmouth County with nearby schools including Frank Defino Central Elementary School, Marlboro Memorial Middle School, and Marlboro High School.
Ownership History
Date
Name
Owned For
Owner Type
Purchase Details
Closed on
Jun 20, 2014
Sold by
Bosamonte Neil and Petrou Liane
Bought by
Bosamonte Neil and Bosamonte Liane
Current Estimated Value
Home Financials for this Owner
Home Financials are based on the most recent Mortgage that was taken out on this home.
Original Mortgage
$270,000
Interest Rate
4.11%
Mortgage Type
New Conventional
Purchase Details
Closed on
Nov 19, 2010
Sold by
Lahmann George P and Lahmann Cheryl
Bought by
Bosamonte Neil and Petrou Liane
Home Financials for this Owner
Home Financials are based on the most recent Mortgage that was taken out on this home.
Original Mortgage
$328,000
Interest Rate
4.22%
Mortgage Type
New Conventional
Purchase Details
Closed on
Dec 7, 2000
Sold by
Toth Matthew
Bought by
Lahmann George and Lahmann Cheryl
Create a Home Valuation Report for This Property
The Home Valuation Report is an in-depth analysis detailing your home's value as well as a comparison with similar homes in the area
Home Values in the Area
Average Home Value in this Area
Purchase History
| Date | Buyer | Sale Price | Title Company |
|---|---|---|---|
| Bosamonte Neil | -- | None Available | |
| Bosamonte Neil | $410,000 | New Jersey Title Ins Co | |
| Lahmann George | $96,000 | -- |
Source: Public Records
Mortgage History
| Date | Status | Borrower | Loan Amount |
|---|---|---|---|
| Closed | Bosamonte Neil | $270,000 | |
| Closed | Bosamonte Neil | $328,000 |
Source: Public Records
Tax History Compared to Growth
Tax History
| Year | Tax Paid | Tax Assessment Tax Assessment Total Assessment is a certain percentage of the fair market value that is determined by local assessors to be the total taxable value of land and additions on the property. | Land | Improvement |
|---|---|---|---|---|
| 2025 | $9,340 | $370,200 | $165,600 | $204,600 |
| 2024 | $8,937 | $370,200 | $165,600 | $204,600 |
| 2023 | $8,937 | $370,200 | $165,600 | $204,600 |
| 2022 | $8,685 | $370,200 | $165,600 | $204,600 |
| 2021 | $8,566 | $370,200 | $165,600 | $204,600 |
| 2020 | $8,559 | $370,200 | $165,600 | $204,600 |
| 2019 | $8,566 | $370,200 | $165,600 | $204,600 |
| 2018 | $8,418 | $370,200 | $165,600 | $204,600 |
| 2017 | $8,255 | $370,200 | $165,600 | $204,600 |
| 2016 | $8,222 | $370,200 | $165,600 | $204,600 |
| 2015 | $7,984 | $364,900 | $165,600 | $199,300 |
| 2014 | $7,879 | $353,600 | $165,600 | $188,000 |
Source: Public Records
Map
Nearby Homes