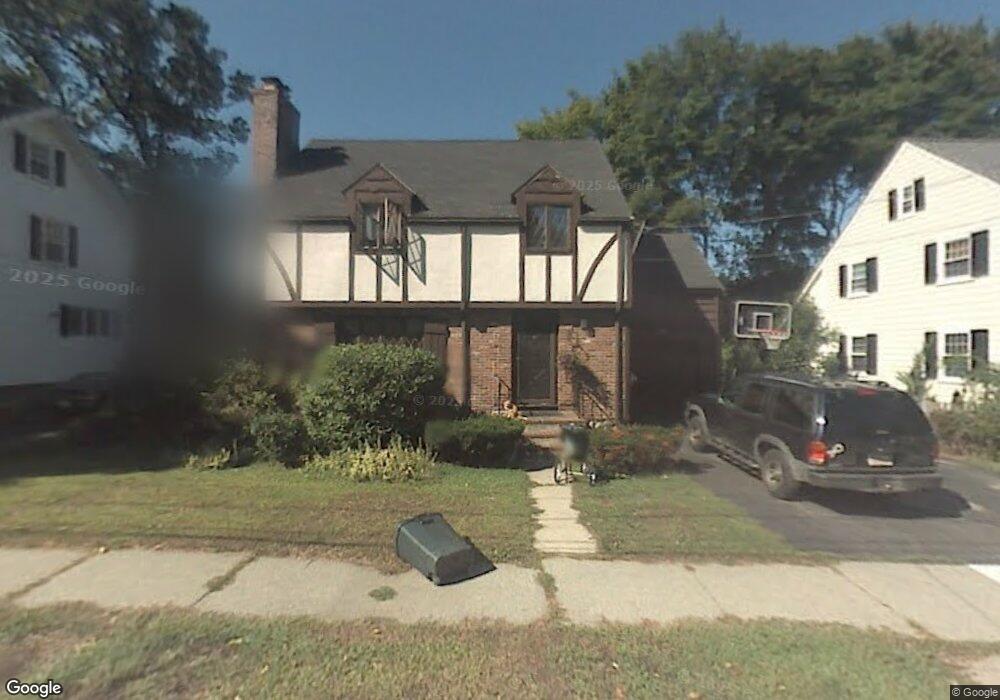
40 Norman Rd Melrose, MA 02176
Melrose East Side NeighborhoodEstimated Value: $1,100,783 - $1,327,000
3
Beds
2
Baths
3,392
Sq Ft
$344/Sq Ft
Est. Value
About This Home
This home is located at 40 Norman Rd, Melrose, MA 02176 and is currently estimated at $1,168,446, approximately $344 per square foot. 40 Norman Rd is a home located in Middlesex County with nearby schools including Winthrop Elementary School, Horace Mann Elementary School, and Hoover Elementary School.
Ownership History
Date
Name
Owned For
Owner Type
Purchase Details
Closed on
Aug 18, 2000
Sold by
Mcguigan Donna M
Bought by
Maguire Brenda M and Maguire Luke W
Current Estimated Value
Home Financials for this Owner
Home Financials are based on the most recent Mortgage that was taken out on this home.
Original Mortgage
$100,000
Interest Rate
8.13%
Mortgage Type
Purchase Money Mortgage
Create a Home Valuation Report for This Property
The Home Valuation Report is an in-depth analysis detailing your home's value as well as a comparison with similar homes in the area
Home Values in the Area
Average Home Value in this Area
Purchase History
| Date | Buyer | Sale Price | Title Company |
|---|---|---|---|
| Maguire Brenda M | $385,000 | -- |
Source: Public Records
Mortgage History
| Date | Status | Borrower | Loan Amount |
|---|---|---|---|
| Open | Maguire Brenda M | $100,000 | |
| Closed | Maguire Brenda M | $100,000 | |
| Previous Owner | Maguire Brenda M | $50,000 |
Source: Public Records
Tax History Compared to Growth
Tax History
| Year | Tax Paid | Tax Assessment Tax Assessment Total Assessment is a certain percentage of the fair market value that is determined by local assessors to be the total taxable value of land and additions on the property. | Land | Improvement |
|---|---|---|---|---|
| 2025 | $85 | $860,300 | $502,100 | $358,200 |
| 2024 | $8,442 | $850,200 | $502,100 | $348,100 |
| 2023 | $7,975 | $765,400 | $447,800 | $317,600 |
| 2022 | $7,676 | $726,200 | $420,700 | $305,500 |
| 2021 | $7,358 | $672,000 | $380,000 | $292,000 |
| 2020 | $7,426 | $672,000 | $379,900 | $292,100 |
| 2019 | $6,607 | $611,200 | $343,300 | $267,900 |
| 2018 | $6,571 | $580,000 | $312,100 | $267,900 |
| 2017 | $6,374 | $540,200 | $298,500 | $241,700 |
| 2016 | $6,097 | $494,500 | $285,000 | $209,500 |
| 2015 | $6,076 | $468,800 | $271,400 | $197,400 |
| 2014 | $6,045 | $455,200 | $257,800 | $197,400 |
Source: Public Records
Map
Nearby Homes
- 65 Lincoln St
- 218 Upham St
- 46 Country Club Rd
- 55 Burrell St
- 109 Linden Rd
- 366 Grove St
- 128 Green St Unit 128
- 110 Ellis Farm Ln
- 83 Altamont Ave
- 225 Howard St
- 8 Crystal St Unit 2
- 8 Crystal St Unit 3
- 515 Upham St
- 6 Linden Rd
- 180 Green St Unit 416
- 36 Slayton Rd
- 30 Wheeler Ave
- 29 Birch Hill Rd
- 33 Mount Hood Terrace
- 236-238 Main St