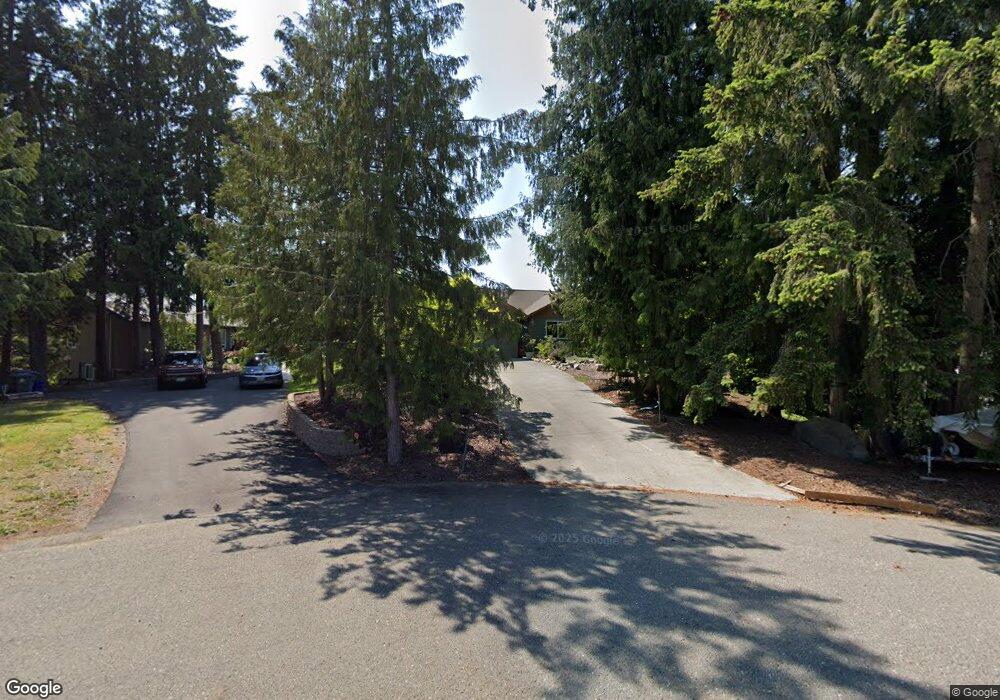
40 Olympian Ct Port Angeles, WA 98362
Estimated Value: $591,304 - $650,000
3
Beds
2
Baths
1,904
Sq Ft
$331/Sq Ft
Est. Value
About This Home
This home is located at 40 Olympian Ct, Port Angeles, WA 98362 and is currently estimated at $629,768, approximately $330 per square foot. 40 Olympian Ct is a home located in Clallam County with nearby schools including Roosevelt Elementary School, Stevens Middle School, and Port Angeles High School.
Ownership History
Date
Name
Owned For
Owner Type
Purchase Details
Closed on
Oct 27, 2010
Sold by
Brewer David C
Bought by
Bowers James Thomas and Bowers Valarie A
Current Estimated Value
Home Financials for this Owner
Home Financials are based on the most recent Mortgage that was taken out on this home.
Original Mortgage
$275,805
Outstanding Balance
$169,859
Interest Rate
3%
Mortgage Type
VA
Estimated Equity
$459,909
Purchase Details
Closed on
Aug 25, 2009
Sold by
Dahl Nancy S
Bought by
Brewer David C
Purchase Details
Closed on
Mar 2, 2009
Sold by
Dodge N P
Bought by
Brewer David C and Dahl Nancy S
Purchase Details
Closed on
Oct 24, 2008
Sold by
Pruss Terry G and Pruss Mary A
Bought by
Dodge N P
Purchase Details
Closed on
Dec 27, 2005
Sold by
Smithco Construction
Bought by
Pruss Terry G and Pruss Mary A
Home Financials for this Owner
Home Financials are based on the most recent Mortgage that was taken out on this home.
Original Mortgage
$256,000
Interest Rate
6.36%
Mortgage Type
Purchase Money Mortgage
Create a Home Valuation Report for This Property
The Home Valuation Report is an in-depth analysis detailing your home's value as well as a comparison with similar homes in the area
Home Values in the Area
Average Home Value in this Area
Purchase History
| Date | Buyer | Sale Price | Title Company |
|---|---|---|---|
| Bowers James Thomas | $270,000 | Clallam Title Company | |
| Brewer David C | -- | None Available | |
| Brewer David C | $251,000 | Clallam Title Co | |
| Dodge N P | $298,750 | Clallam Title Co | |
| Pruss Terry G | $320,000 | None Available |
Source: Public Records
Mortgage History
| Date | Status | Borrower | Loan Amount |
|---|---|---|---|
| Open | Bowers James Thomas | $275,805 | |
| Previous Owner | Pruss Terry G | $256,000 |
Source: Public Records
Tax History Compared to Growth
Tax History
| Year | Tax Paid | Tax Assessment Tax Assessment Total Assessment is a certain percentage of the fair market value that is determined by local assessors to be the total taxable value of land and additions on the property. | Land | Improvement |
|---|---|---|---|---|
| 2021 | $4,705 | $376,491 | $31,136 | $345,355 |
| 2020 | $3,566 | $345,528 | $31,136 | $314,392 |
| 2018 | $3,478 | $307,527 | $31,136 | $276,391 |
| 2017 | $2,875 | $288,864 | $31,136 | $257,728 |
| 2016 | $2,875 | $290,647 | $31,136 | $259,511 |
| 2015 | $2,875 | $280,642 | $31,136 | $249,506 |
| 2013 | $2,875 | $247,177 | $31,136 | $216,041 |
| 2012 | $2,875 | $249,404 | $31,136 | $218,268 |
Source: Public Records
Map
Nearby Homes
- 9999
- 9999 Olympian Way Unit 9
- Parcel 9 Olympian Way
- Parcel 10 Olympic Meadows
- 9999 Cedar Glen Ln
- Parcel 11 Olympic Meadows
- 9999 Olympic Meadows Parcel 10
- 5 Cedar Glen Ln
- 100 Crestview Dr
- 1002 A Lemmon Rd
- 1000 Lemmon Rd
- 1002A Lemmon Rd
- 9999 Levig Rd
- 754 Gasman Rd
- 73 Tonda Vista Rd
- 9999 Bravo Lot 2 Rd
- 9999 Bravo Rd Lot 2
- 999 Largent Ln
- 137 Bravo Rd
- 71 John Jacobs Rd
- 30 Olympian Ct
- 50 Olympian Ct
- 50 Olympian Ct
- 10 Olympian Ct
- 52 Olympian Ct
- 31 Olympian Ct
- 261 Olympian Way
- 171 Olympian Way
- 9999 Olympian Way
- 9999 Cedar Glen
- 161 Olympian Way
- 210 Olympian Way
- 230 Olympian Way
- 171 Cedar Glen Ln
- 240 Olympian Way
- 260 Olympian Way
- 272 Olympian Way
- 121 Olympian Way
- 190 Olympian Way
- 81 Cedar Glen Ln