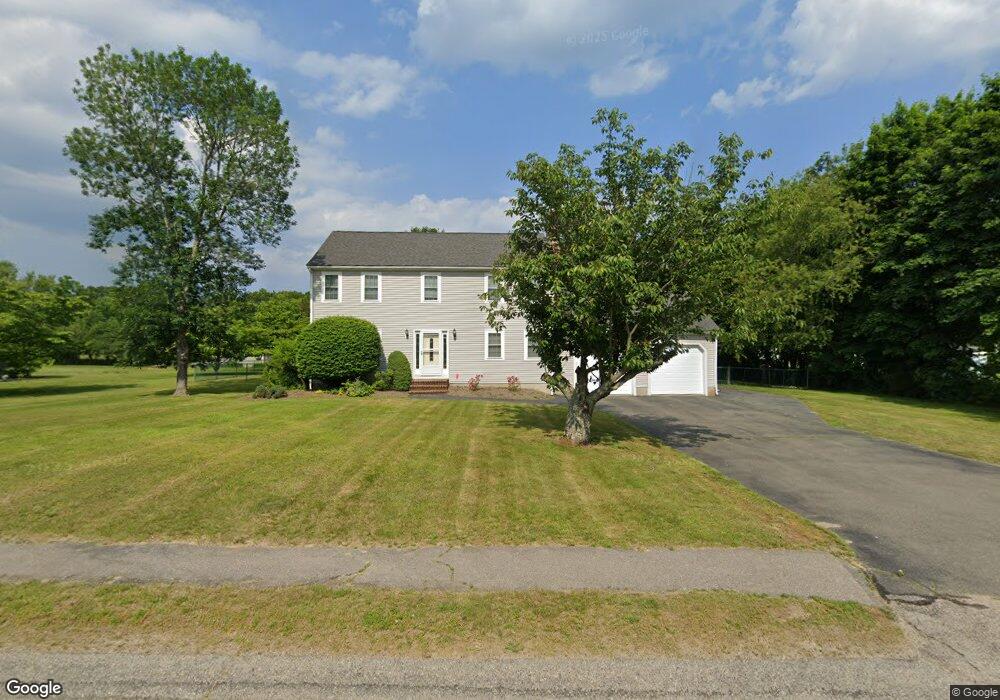
40 Orchard Dr West Bridgewater, MA 02379
Estimated Value: $651,467 - $686,000
4
Beds
3
Baths
1,872
Sq Ft
$354/Sq Ft
Est. Value
About This Home
This home is located at 40 Orchard Dr, West Bridgewater, MA 02379 and is currently estimated at $662,367, approximately $353 per square foot. 40 Orchard Dr is a home located in Plymouth County with nearby schools including Spring Street Elementary School, Howard Elementary School, and Rose L. MacDonald Elementary School.
Ownership History
Date
Name
Owned For
Owner Type
Purchase Details
Closed on
Jun 25, 2007
Sold by
Francisco Pamela L
Bought by
Miller Mark T and Miller Susan S
Current Estimated Value
Purchase Details
Closed on
Mar 1, 2004
Sold by
Lang James C and Lang Deborah W
Bought by
Francisco Pamela L
Purchase Details
Closed on
Nov 26, 1993
Sold by
Hazard & Boyle Rt and Mack Cynthia
Bought by
Lang Ii James C
Create a Home Valuation Report for This Property
The Home Valuation Report is an in-depth analysis detailing your home's value as well as a comparison with similar homes in the area
Home Values in the Area
Average Home Value in this Area
Purchase History
| Date | Buyer | Sale Price | Title Company |
|---|---|---|---|
| Miller Mark T | $440,000 | -- | |
| Francisco Pamela L | $415,000 | -- | |
| Lang Ii James C | $193,000 | -- |
Source: Public Records
Mortgage History
| Date | Status | Borrower | Loan Amount |
|---|---|---|---|
| Open | Lang Ii James C | $236,000 | |
| Closed | Lang Ii James C | $239,500 |
Source: Public Records
Tax History Compared to Growth
Tax History
| Year | Tax Paid | Tax Assessment Tax Assessment Total Assessment is a certain percentage of the fair market value that is determined by local assessors to be the total taxable value of land and additions on the property. | Land | Improvement |
|---|---|---|---|---|
| 2025 | $7,592 | $555,400 | $236,400 | $319,000 |
| 2024 | $7,404 | $522,500 | $215,600 | $306,900 |
| 2023 | $7,061 | $459,400 | $192,800 | $266,600 |
| 2022 | $6,918 | $426,500 | $184,500 | $242,000 |
| 2021 | $4,088 | $405,500 | $184,500 | $221,000 |
| 2020 | $7,420 | $413,900 | $184,500 | $229,400 |
| 2019 | $6,703 | $405,500 | $184,500 | $221,000 |
| 2018 | $6,488 | $380,500 | $165,900 | $214,600 |
| 2017 | $6,418 | $362,000 | $155,500 | $206,500 |
| 2016 | $6,329 | $351,600 | $145,100 | $206,500 |
| 2015 | $6,136 | $344,500 | $145,100 | $199,400 |
| 2014 | $5,681 | $344,500 | $145,100 | $199,400 |
Source: Public Records
Map
Nearby Homes