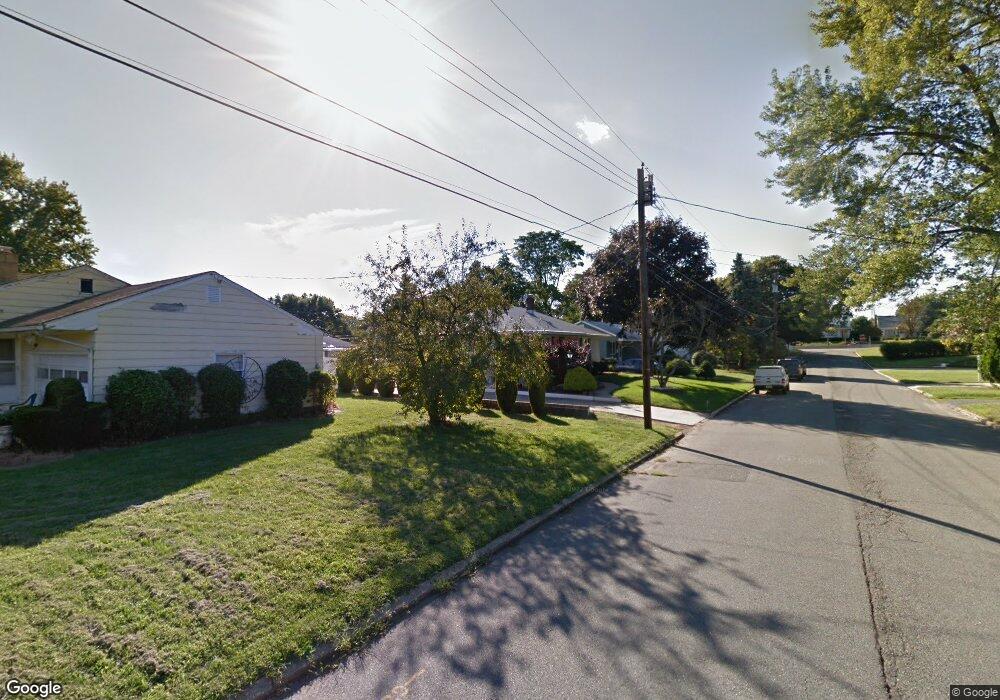
40 Orchard St South Amboy, NJ 08879
Estimated Value: $520,929 - $573,000
--
Bed
--
Bath
--
Sq Ft
7,492
Sq Ft Lot
About This Home
This home is located at 40 Orchard St, South Amboy, NJ 08879 and is currently estimated at $552,732. 40 Orchard St is a home located in Middlesex County with nearby schools including Sayreville War Memorial High School, St. Mary Elementary School, and New Road School of Parlin.
Ownership History
Date
Name
Owned For
Owner Type
Purchase Details
Closed on
Feb 12, 2010
Bought by
Ribeiro Jose A
Current Estimated Value
Home Financials for this Owner
Home Financials are based on the most recent Mortgage that was taken out on this home.
Original Mortgage
$260,327
Outstanding Balance
$170,908
Interest Rate
4.87%
Mortgage Type
FHA
Estimated Equity
$381,824
Purchase Details
Closed on
Feb 8, 2010
Sold by
Ribeiro Jose A and Ferreira Nancy
Bought by
Ribeiro Jose A
Home Financials for this Owner
Home Financials are based on the most recent Mortgage that was taken out on this home.
Original Mortgage
$260,327
Outstanding Balance
$170,908
Interest Rate
4.87%
Mortgage Type
FHA
Estimated Equity
$381,824
Purchase Details
Closed on
Apr 21, 2004
Sold by
Belko George
Bought by
Ribeiro Jose and Ferreira Nancy
Home Financials for this Owner
Home Financials are based on the most recent Mortgage that was taken out on this home.
Original Mortgage
$245,600
Interest Rate
5.75%
Create a Home Valuation Report for This Property
The Home Valuation Report is an in-depth analysis detailing your home's value as well as a comparison with similar homes in the area
Home Values in the Area
Average Home Value in this Area
Purchase History
| Date | Buyer | Sale Price | Title Company |
|---|---|---|---|
| Ribeiro Jose A | $100 | -- | |
| Ribeiro Jose A | -- | Stewart Title Guaranty Co | |
| Ribeiro Jose | $307,000 | -- |
Source: Public Records
Mortgage History
| Date | Status | Borrower | Loan Amount |
|---|---|---|---|
| Open | Ribeiro Jose A | $260,327 | |
| Previous Owner | Ribeiro Jose | $245,600 |
Source: Public Records
Tax History Compared to Growth
Tax History
| Year | Tax Paid | Tax Assessment Tax Assessment Total Assessment is a certain percentage of the fair market value that is determined by local assessors to be the total taxable value of land and additions on the property. | Land | Improvement |
|---|---|---|---|---|
| 2025 | $9,817 | $160,800 | $57,800 | $103,000 |
| 2024 | $9,545 | $160,800 | $57,800 | $103,000 |
| 2023 | $9,545 | $160,800 | $57,800 | $103,000 |
| 2022 | $8,916 | $160,800 | $57,800 | $103,000 |
| 2021 | $8,818 | $160,800 | $57,800 | $103,000 |
| 2020 | $8,595 | $160,800 | $57,800 | $103,000 |
| 2019 | $8,415 | $160,800 | $57,800 | $103,000 |
| 2018 | $8,264 | $160,800 | $57,800 | $103,000 |
| 2017 | $8,072 | $160,800 | $57,800 | $103,000 |
| 2016 | $7,857 | $160,800 | $57,800 | $103,000 |
| 2015 | $7,678 | $160,800 | $57,800 | $103,000 |
| 2014 | $7,472 | $160,800 | $57,800 | $103,000 |
Source: Public Records
Map
Nearby Homes
- 741 Bordentown Ave
- 15 Bertram Ave
- 320 Parker Ave
- 442 Bordentown Ave
- 42 Merritt Ave
- 433 Gordon St
- 2950 Washington Rd
- 243 Elm St
- 3350 Washington Rd
- 221 S Pine Ave
- 363 Ferris St
- 365 John St
- 110 N Pine Ave
- 326 Walnut St
- 363 Portia St
- 5 Gardner Place
- 24 Eugene Blvd
- 322 George St
- 370 6th St
- 25 Eugene Blvd