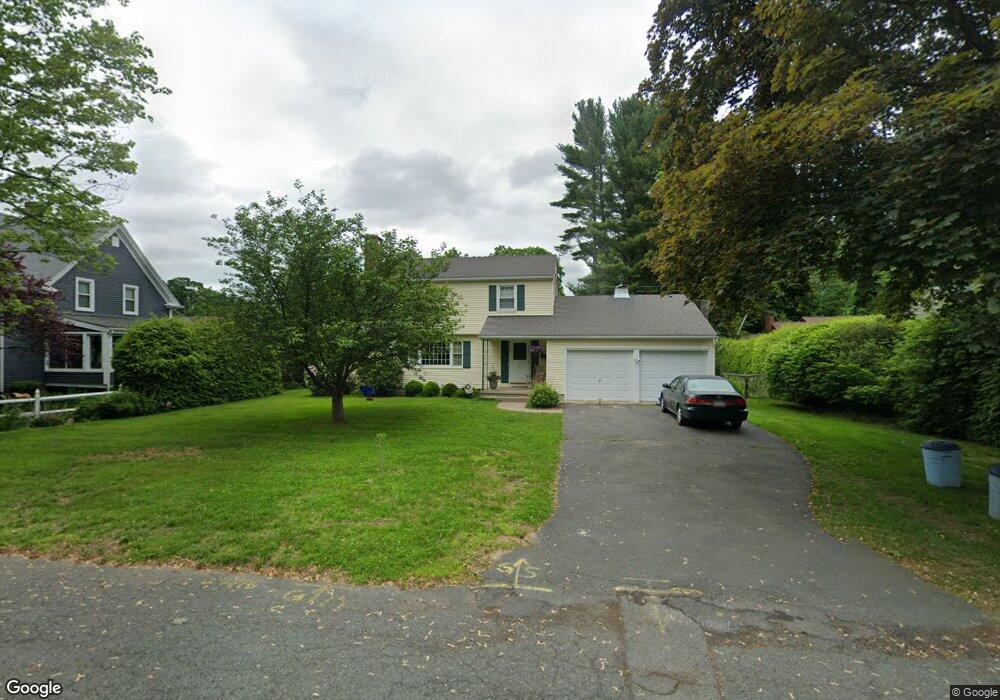
40 Orchard St Westfield, MA 01085
Estimated Value: $393,490 - $460,000
3
Beds
2
Baths
1,750
Sq Ft
$242/Sq Ft
Est. Value
About This Home
This home is located at 40 Orchard St, Westfield, MA 01085 and is currently estimated at $424,373, approximately $242 per square foot. 40 Orchard St is a home located in Hampden County with nearby schools including Westfield High School and Saint Mary High School.
Ownership History
Date
Name
Owned For
Owner Type
Purchase Details
Closed on
Aug 20, 2021
Sold by
Hagan James C and Hagan Kristin
Bought by
Castanera Christopher D and Parker Margaret M
Current Estimated Value
Home Financials for this Owner
Home Financials are based on the most recent Mortgage that was taken out on this home.
Original Mortgage
$292,500
Outstanding Balance
$265,973
Interest Rate
2.9%
Mortgage Type
Purchase Money Mortgage
Estimated Equity
$158,400
Purchase Details
Closed on
Jul 24, 2013
Sold by
Hagan Charles D and Hagan Kathleen M
Bought by
Hagan James C and Hagan Kristin
Purchase Details
Closed on
Jun 10, 2008
Sold by
Hagan Rt and Hagan Charles D
Bought by
Hagan Charles D and Hagan Kathleen M
Create a Home Valuation Report for This Property
The Home Valuation Report is an in-depth analysis detailing your home's value as well as a comparison with similar homes in the area
Home Values in the Area
Average Home Value in this Area
Purchase History
| Date | Buyer | Sale Price | Title Company |
|---|---|---|---|
| Castanera Christopher D | $325,000 | None Available | |
| Hagan James C | -- | -- | |
| Hagan Charles D | -- | -- |
Source: Public Records
Mortgage History
| Date | Status | Borrower | Loan Amount |
|---|---|---|---|
| Open | Castanera Christopher D | $292,500 |
Source: Public Records
Tax History Compared to Growth
Tax History
| Year | Tax Paid | Tax Assessment Tax Assessment Total Assessment is a certain percentage of the fair market value that is determined by local assessors to be the total taxable value of land and additions on the property. | Land | Improvement |
|---|---|---|---|---|
| 2025 | $5,022 | $330,800 | $114,400 | $216,400 |
| 2024 | $5,026 | $314,700 | $104,100 | $210,600 |
| 2023 | $4,663 | $283,900 | $99,100 | $184,800 |
| 2022 | $4,663 | $252,200 | $88,600 | $163,600 |
| 2021 | $4,520 | $239,400 | $83,500 | $155,900 |
| 2020 | $4,385 | $227,800 | $83,500 | $144,300 |
| 2019 | $3,334 | $217,900 | $79,400 | $138,500 |
| 2018 | $4,219 | $217,900 | $79,400 | $138,500 |
| 2017 | $4,142 | $213,300 | $80,600 | $132,700 |
| 2016 | $4,147 | $213,300 | $80,600 | $132,700 |
| 2015 | $3,812 | $205,600 | $80,600 | $125,000 |
| 2014 | $2,850 | $205,600 | $80,600 | $125,000 |
Source: Public Records
Map
Nearby Homes
- 11 Highland Cir
- 324 Russell Rd Unit 204
- 78 Granville Rd Unit 11
- 128 Crane Ave
- 508 Granville Rd
- 0 Fox Hill Dr
- 53 Yankee Cir
- 549 Russell Rd Unit 6B
- 40 Heritage Ln
- 555 Russell Rd Unit D18
- 291 Pochassic Rd
- 172 Valley View Dr
- 13 King Place
- 15 Bates St
- 113 Franklin St
- 82 S Maple St Unit 11
- 82 S Maple St Unit 43
- 70 S Maple St
- 14 Pinewood Ln
- 74 S Maple St