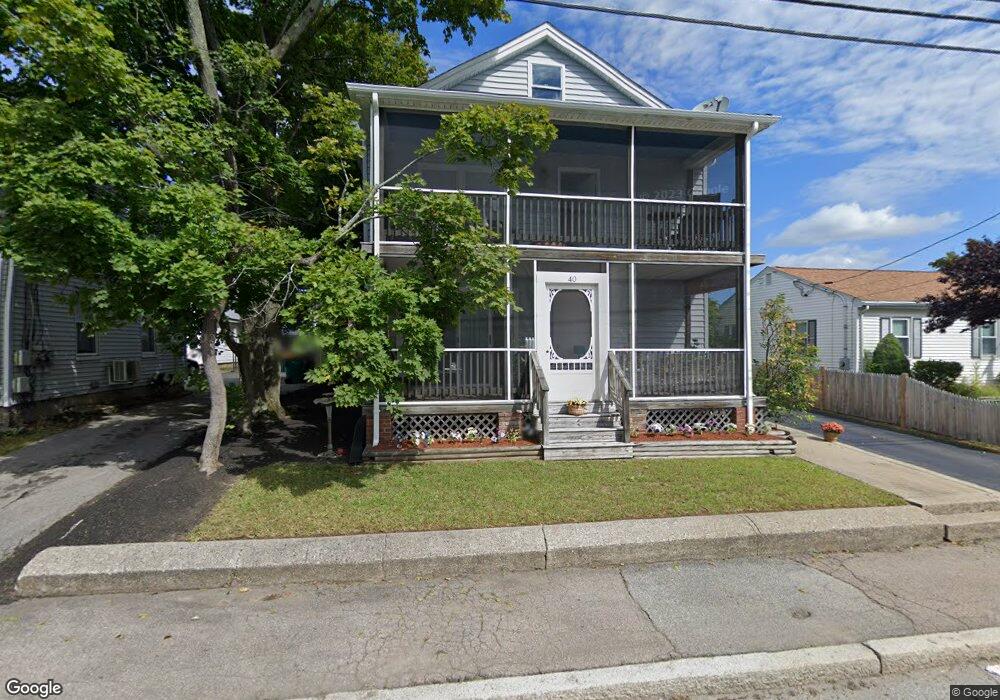
40 Orne St North Attleboro, MA 02760
North Attleboro NeighborhoodEstimated Value: $545,718 - $652,000
5
Beds
2
Baths
2,112
Sq Ft
$294/Sq Ft
Est. Value
About This Home
This home is located at 40 Orne St, North Attleboro, MA 02760 and is currently estimated at $621,430, approximately $294 per square foot. 40 Orne St is a home located in Bristol County with nearby schools including North Attleboro High School.
Ownership History
Date
Name
Owned For
Owner Type
Purchase Details
Closed on
Mar 12, 2002
Sold by
Boothe Alan J and Boothe Michael S
Bought by
Boothe Michael S and Boothe Francie E
Current Estimated Value
Home Financials for this Owner
Home Financials are based on the most recent Mortgage that was taken out on this home.
Original Mortgage
$162,000
Outstanding Balance
$67,433
Interest Rate
7.01%
Mortgage Type
Purchase Money Mortgage
Estimated Equity
$553,997
Purchase Details
Closed on
May 27, 1994
Sold by
Kinasewich Eugene and Kinasewich Janet E
Bought by
Boothe Alan J and Boothe Lori A
Create a Home Valuation Report for This Property
The Home Valuation Report is an in-depth analysis detailing your home's value as well as a comparison with similar homes in the area
Home Values in the Area
Average Home Value in this Area
Purchase History
| Date | Buyer | Sale Price | Title Company |
|---|---|---|---|
| Boothe Michael S | $60,000 | -- | |
| Boothe Alan J | $74,000 | -- |
Source: Public Records
Mortgage History
| Date | Status | Borrower | Loan Amount |
|---|---|---|---|
| Open | Boothe Alan J | $58,000 | |
| Open | Boothe Alan J | $162,000 | |
| Previous Owner | Boothe Alan J | $19,000 |
Source: Public Records
Tax History Compared to Growth
Tax History
| Year | Tax Paid | Tax Assessment Tax Assessment Total Assessment is a certain percentage of the fair market value that is determined by local assessors to be the total taxable value of land and additions on the property. | Land | Improvement |
|---|---|---|---|---|
| 2025 | $5,318 | $451,100 | $107,400 | $343,700 |
| 2024 | $5,093 | $441,300 | $107,400 | $333,900 |
| 2023 | $4,805 | $375,700 | $107,400 | $268,300 |
| 2022 | $5,346 | $383,800 | $102,000 | $281,800 |
| 2021 | $4,414 | $309,300 | $96,700 | $212,600 |
| 2020 | $3,837 | $267,400 | $91,300 | $176,100 |
| 2019 | $3,690 | $259,100 | $83,000 | $176,100 |
| 2018 | $2,905 | $217,800 | $78,100 | $139,700 |
| 2017 | $2,815 | $212,900 | $73,200 | $139,700 |
| 2016 | $2,606 | $197,100 | $97,600 | $99,500 |
| 2015 | $2,590 | $197,100 | $97,600 | $99,500 |
| 2014 | $2,661 | $201,000 | $91,600 | $109,400 |
Source: Public Records
Map
Nearby Homes
- 19 Church St Unit A5
- 16 Richards Ave Unit 106
- 68 Fisher St
- 880 Landry Ave Unit 2
- 633 E Washington St Unit 10
- 20 Holbrook Ave
- 42 2nd Ave Unit 24
- 0 Landry 2nd Unit 73350867
- 85 Richards Ave
- 58 Jay St
- 93 Bank St
- 8 Al Pace Dr Unit 8
- 212 Fisher St Unit A5
- 217 Fisher St
- 20 South St
- 151 Roosevelt Ave Unit A
- 64 Smith St
- 33 Ash St
- 300 E Washington St Unit 4M
- 300 E Washington St Unit 54R