Estimated Value: $287,000 - $301,000
5
Beds
3
Baths
2,300
Sq Ft
$129/Sq Ft
Est. Value
About This Home
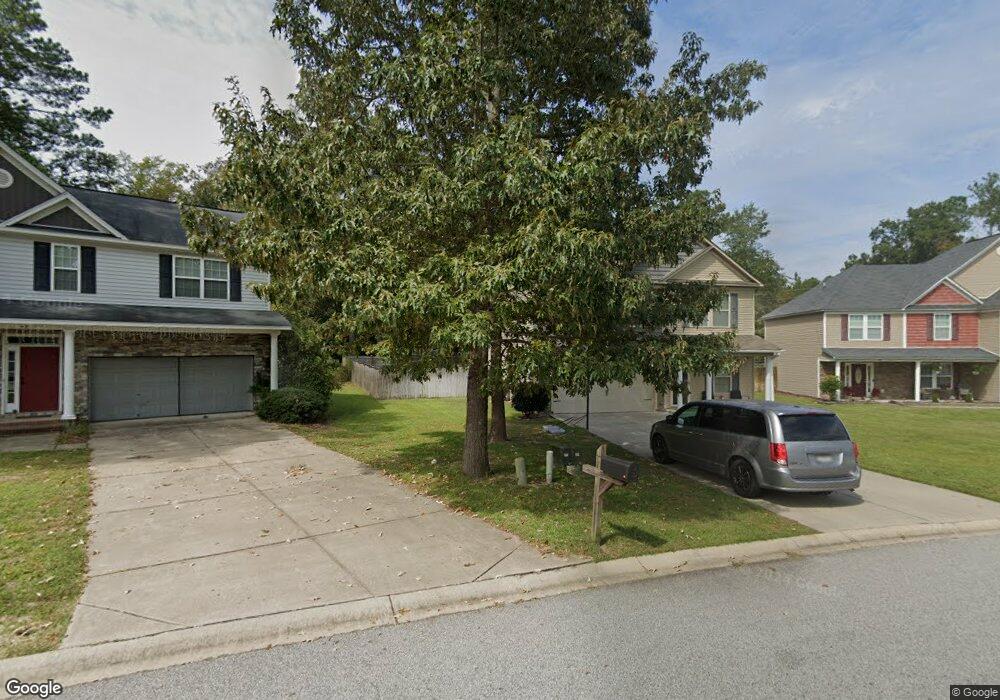
This home is located at 40 Pear Tree Loop, Elgin, SC 29045 and is currently estimated at $295,648, approximately $128 per square foot. 40 Pear Tree Loop is a home located in Kershaw County with nearby schools including Doby's Mill Elementary School, Leslie M. Stover Middle School, and Lugoff-Elgin High School.
Ownership History
Date
Name
Owned For
Owner Type
Purchase Details
Closed on
Nov 19, 2021
Sold by
Paige Timothy M
Bought by
Kendrick Gary P and Kendrick Maria Fe
Current Estimated Value
Home Financials for this Owner
Home Financials are based on the most recent Mortgage that was taken out on this home.
Original Mortgage
$246,380
Outstanding Balance
$225,290
Interest Rate
2.99%
Mortgage Type
New Conventional
Estimated Equity
$70,358
Purchase Details
Closed on
Jul 30, 2018
Sold by
Heath Smith
Bought by
Paige Timothy M and Paige Paula Vega
Home Financials for this Owner
Home Financials are based on the most recent Mortgage that was taken out on this home.
Original Mortgage
$183,870
Interest Rate
4.6%
Mortgage Type
VA
Purchase Details
Closed on
Oct 30, 2015
Sold by
Great Southern Homes Inc
Bought by
Smith Heath
Purchase Details
Closed on
May 23, 2014
Sold by
Woodtrace Llc
Bought by
Great Southern Homes Inc
Create a Home Valuation Report for This Property
The Home Valuation Report is an in-depth analysis detailing your home's value as well as a comparison with similar homes in the area
Purchase History
| Date | Buyer | Sale Price | Title Company |
|---|---|---|---|
| Kendrick Gary P | $254,000 | Blair Cato Pickren Casterline | |
| Paige Timothy M | $180,000 | -- | |
| Smith Heath | $165,000 | -- | |
| Great Southern Homes Inc | $23,000 | -- |
Source: Public Records
Mortgage History
| Date | Status | Borrower | Loan Amount |
|---|---|---|---|
| Open | Kendrick Gary P | $246,380 | |
| Previous Owner | Paige Timothy M | $183,870 |
Source: Public Records
Tax History
| Year | Tax Paid | Tax Assessment Tax Assessment Total Assessment is a certain percentage of the fair market value that is determined by local assessors to be the total taxable value of land and additions on the property. | Land | Improvement |
|---|---|---|---|---|
| 2025 | $1,559 | $254,000 | $25,000 | $229,000 |
| 2024 | $1,559 | $254,000 | $25,000 | $229,000 |
| 2023 | $383 | $254,000 | $25,000 | $229,000 |
| 2022 | $1,502 | $254,000 | $25,000 | $229,000 |
| 2021 | $1,219 | $205,500 | $25,000 | $180,500 |
| 2020 | $1,074 | $180,900 | $25,000 | $155,900 |
| 2019 | $1,112 | $180,900 | $25,000 | $155,900 |
| 2018 | $1,043 | $180,900 | $25,000 | $155,900 |
| 2017 | $923 | $165,300 | $25,000 | $140,300 |
| 2016 | $908 | $165,000 | $25,000 | $140,000 |
| 2015 | $234 | $25,000 | $25,000 | $0 |
| 2014 | $234 | $0 | $0 | $0 |
Source: Public Records
Map
Nearby Homes
- 83 Elmwood Blvd S
- 1009 Campbell Ridge Dr
- 2668 Steven Campbell Rd
- 1151 Campbell Ridge Dr
- 61 Saughtree Ln W
- 6005 Edgemont Ct
- 2064 County Line Trail
- 2086 County Line Trail
- 2062 County Line Trail
- 2080 County Line Trail
- 2068 County Line Trail
- 3015 Hallsdale Dr
- 3060 Hallsdale Dr
- 3074 Hallsdale Dr
- 3010 Hallsdale Dr
- 3007 Hallsdale Dr
- 3008 Hallsdale Dr
- 3020 Hallsdale Dr
- 5026 Erwin Ct
- 6024 Edgemont Ct
- 42 Pear Tree Loop
- 38 Pear Tree Loop
- 36 Pear Tree Loop
- 44 Pear Tree Loop
- 39 Pear Tree Loop
- 33 Pear Tree Loop
- 32 Pear Tree Loop
- 46 Pear Tree Loop
- 20 Lone Oak Ct
- 29 Pear Tree Loop
- 16 Lone Oak Ct
- 2469 Miles Rd
- 24 Lone Oak Ct
- 28 Pear Tree Loop
- 12 Lone Oak Ct
- 17 Lone Oak Ct
- 15 Lone Oak Ct
- 37 Lone Oak Ct
- 33 Lone Oak Ct
- 31 Lone Oak Ct