Estimated Value: $116,980 - $176,000
3
Beds
1
Bath
1,290
Sq Ft
$124/Sq Ft
Est. Value
About This Home
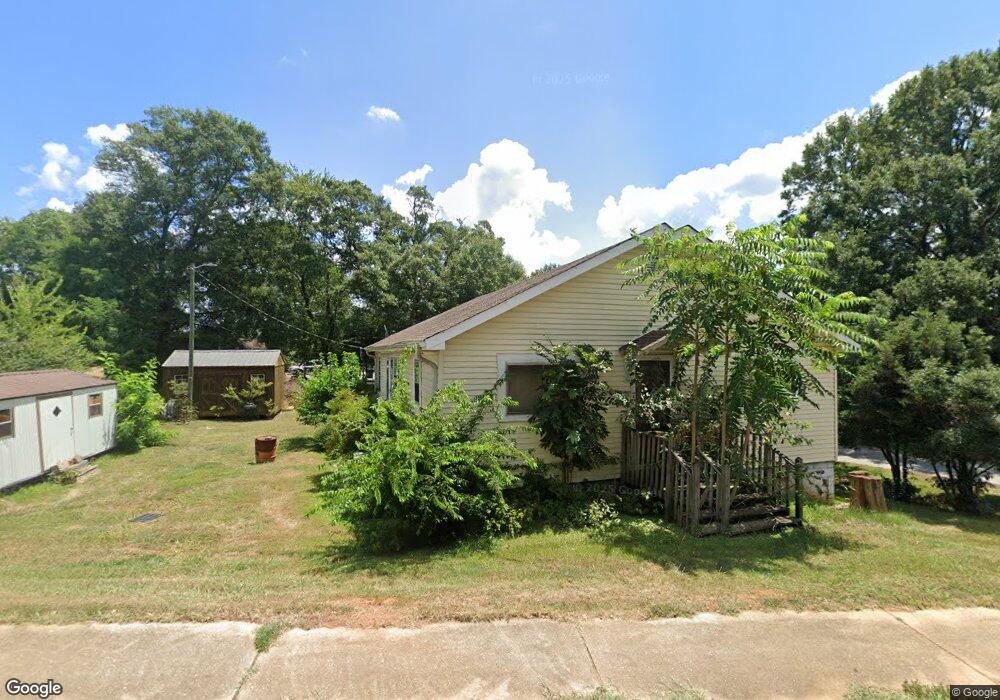
This home is located at 40 Pine St, Inman, SC 29349 and is currently estimated at $159,495, approximately $123 per square foot. 40 Pine St is a home located in Spartanburg County with nearby schools including Inman Elementary School, T.E. Mabry Middle School, and Chapman High School.
Ownership History
Date
Name
Owned For
Owner Type
Purchase Details
Closed on
Nov 26, 2017
Sold by
Josey Dorothy C
Bought by
Thomas Fatena Lynette
Current Estimated Value
Purchase Details
Closed on
Sep 28, 2004
Sold by
Josey Dorothy C
Bought by
Thomas Fatina Lynette
Purchase Details
Closed on
Sep 16, 2004
Sold by
Milliken & Co
Bought by
Ewart Charles P and Ewart Jo Ann
Purchase Details
Closed on
Nov 30, 2000
Sold by
Carl Rusty Fraley Construction Co Inc
Bought by
Beta Llc
Create a Home Valuation Report for This Property
The Home Valuation Report is an in-depth analysis detailing your home's value as well as a comparison with similar homes in the area
Home Values in the Area
Average Home Value in this Area
Purchase History
| Date | Buyer | Sale Price | Title Company |
|---|---|---|---|
| Thomas Fatena Lynette | -- | None Available | |
| Thomas Fatina Lynette | $50,000 | -- | |
| Josey Dorothy C | $52,500 | -- | |
| Ewart Charles P | $5,000 | -- | |
| Beta Llc | $15,389 | -- |
Source: Public Records
Mortgage History
| Date | Status | Borrower | Loan Amount |
|---|---|---|---|
| Closed | Beta Llc | -- | |
| Closed | Thomas Fatina Lynette | $0 |
Source: Public Records
Tax History
| Year | Tax Paid | Tax Assessment Tax Assessment Total Assessment is a certain percentage of the fair market value that is determined by local assessors to be the total taxable value of land and additions on the property. | Land | Improvement |
|---|---|---|---|---|
| 2022 | $64 | $2,000 | $480 | $1,520 |
| 2021 | $64 | $2,000 | $480 | $1,520 |
| 2020 | $57 | $2,000 | $480 | $1,520 |
| 2019 | $148 | $2,512 | $600 | $1,912 |
| 2018 | $148 | $2,512 | $600 | $1,912 |
| 2017 | $57 | $1,825 | $474 | $1,351 |
| 2016 | $57 | $1,825 | $474 | $1,351 |
| 2015 | $52 | $1,825 | $474 | $1,351 |
| 2014 | $47 | $1,825 | $474 | $1,351 |
Source: Public Records
Map
Nearby Homes
Your Personal Tour Guide
Ask me questions while you tour the home.