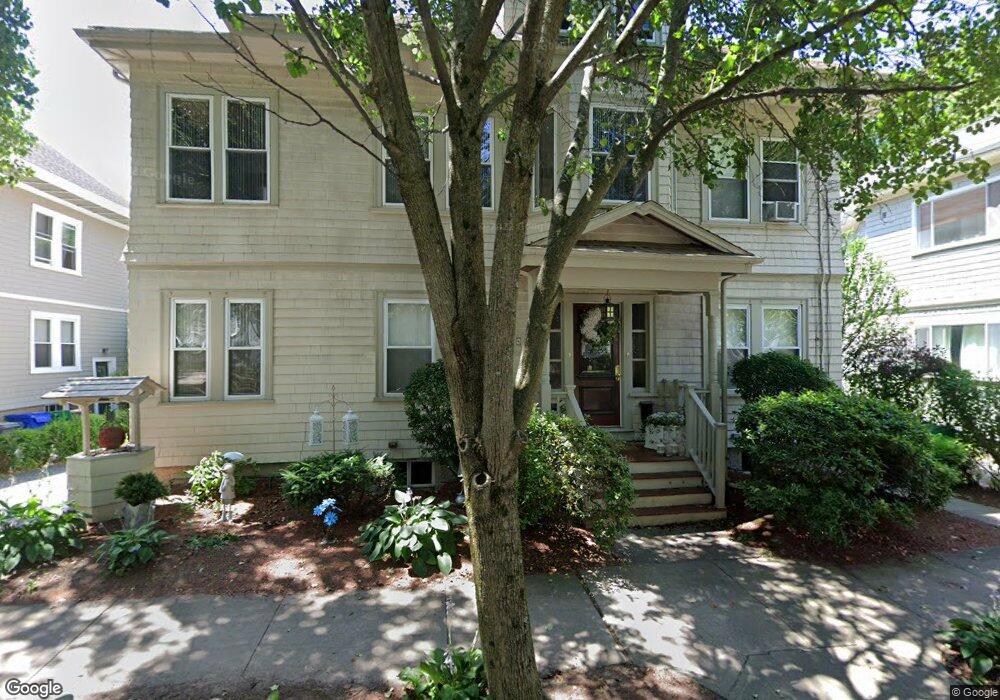
40 Playstead Rd Newton, MA 02458
Newton Corner NeighborhoodEstimated Value: $1,226,000 - $1,372,000
4
Beds
2
Baths
2,528
Sq Ft
$507/Sq Ft
Est. Value
About This Home
This home is located at 40 Playstead Rd, Newton, MA 02458 and is currently estimated at $1,280,509, approximately $506 per square foot. 40 Playstead Rd is a home located in Middlesex County with nearby schools including Underwood Elementary School, Bigelow Middle School, and Newton North High School.
Ownership History
Date
Name
Owned For
Owner Type
Purchase Details
Closed on
Aug 25, 2003
Sold by
Daley Kathleen M and Daley Kathleen F
Bought by
Daley Kathleen M and Daley Kevin
Current Estimated Value
Create a Home Valuation Report for This Property
The Home Valuation Report is an in-depth analysis detailing your home's value as well as a comparison with similar homes in the area
Home Values in the Area
Average Home Value in this Area
Purchase History
| Date | Buyer | Sale Price | Title Company |
|---|---|---|---|
| Daley Kathleen M | -- | -- |
Source: Public Records
Tax History
| Year | Tax Paid | Tax Assessment Tax Assessment Total Assessment is a certain percentage of the fair market value that is determined by local assessors to be the total taxable value of land and additions on the property. | Land | Improvement |
|---|---|---|---|---|
| 2025 | $10,390 | $1,060,200 | $805,600 | $254,600 |
| 2024 | $10,046 | $1,029,300 | $782,100 | $247,200 |
| 2023 | $9,652 | $948,100 | $621,000 | $327,100 |
| 2022 | $9,236 | $877,900 | $575,000 | $302,900 |
| 2021 | $8,666 | $805,400 | $527,500 | $277,900 |
| 2020 | $8,408 | $805,400 | $527,500 | $277,900 |
| 2019 | $7,866 | $752,700 | $493,000 | $259,700 |
| 2018 | $7,786 | $719,600 | $465,000 | $254,600 |
| 2017 | $7,341 | $660,200 | $426,600 | $233,600 |
| 2016 | $6,893 | $605,700 | $391,400 | $214,300 |
| 2015 | $6,572 | $566,100 | $365,800 | $200,300 |
Source: Public Records
Map
Nearby Homes
- 143 Tremont St Unit A
- 70 Washington St Unit 70
- 99 Tremont St Unit 206
- 99 Tremont St Unit 105
- 99 Tremont St Unit 302
- 69 Presentation Rd
- 106 Farlow Rd
- 180 Hunnewell Ave Unit 180
- 180 Hunnewell Ave Unit A
- 123 Park St
- 96 Brayton Rd
- 159 Washington St Unit 4
- 427-435 Faneuil St Unit R4
- 22 Bigelow St
- 68 Vernon St
- 144 Newton St Unit 1
- 65-67 Saint James Cir
- 269 Franklin St
- 39 Charlesbank Rd Unit 39
- 4 Remick Terrace
- 44 Playstead Rd Unit 2
- 44 Playstead Rd Unit 1
- 44 Playstead Rd Unit 1,44
- 34 Playstead Rd Unit 2
- 34 Playstead Rd Unit 1
- 179 Tremont St
- 179 Tremont St Unit 2
- 179 Tremont St
- 179 Tremont St Unit 1
- 183 Tremont St
- 183 Tremont St
- 183 Tremont St Unit 1
- 183 Tremont St Unit 2
- 37 Playstead Rd
- 43 Playstead Rd
- 30 Playstead Rd
- 30 Playstead Rd Unit 1
- 50 Playstead Rd Unit 2
- 50 Playstead Rd Unit 1
- 50 Playstead Rd Unit 2-50
Your Personal Tour Guide
Ask me questions while you tour the home.