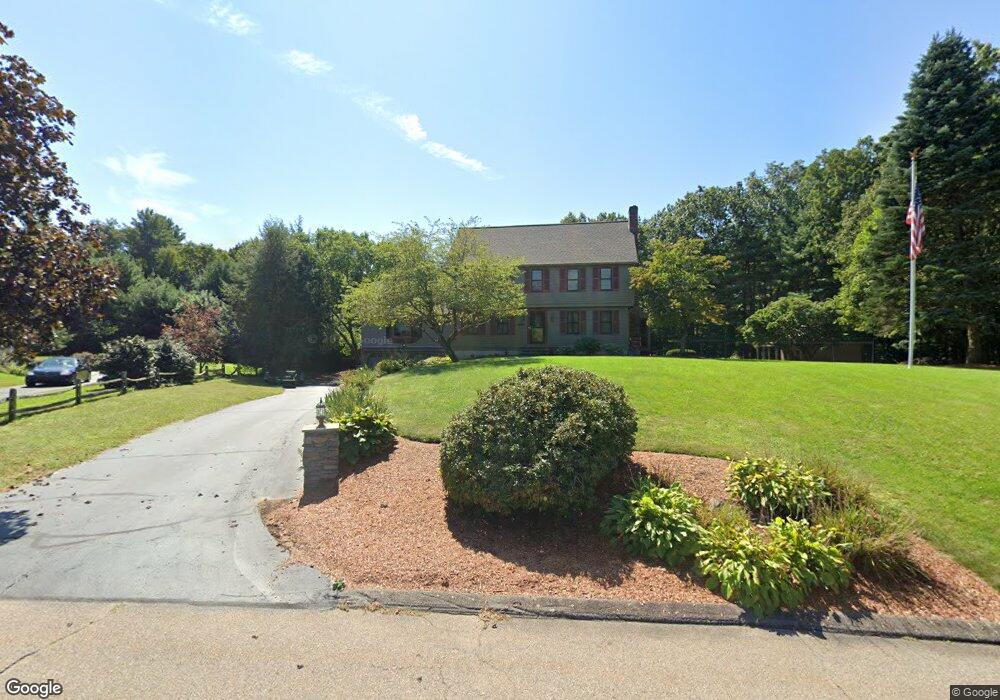
40 Pond St Wrentham, MA 02093
Estimated Value: $815,000 - $1,010,000
3
Beds
3
Baths
2,648
Sq Ft
$335/Sq Ft
Est. Value
About This Home
This home is located at 40 Pond St, Wrentham, MA 02093 and is currently estimated at $885,912, approximately $334 per square foot. 40 Pond St is a home located in Norfolk County with nearby schools including Delaney Elementary School, Charles E Roderick, and Foxborough Regional Charter School.
Ownership History
Date
Name
Owned For
Owner Type
Purchase Details
Closed on
Nov 7, 2023
Sold by
Delorie John G and Delorie Lauren L
Bought by
John G Delorie Jr Lt and Delorie
Current Estimated Value
Purchase Details
Closed on
Jun 30, 1986
Bought by
Delorie John G and Delorie Lauren L
Create a Home Valuation Report for This Property
The Home Valuation Report is an in-depth analysis detailing your home's value as well as a comparison with similar homes in the area
Purchase History
| Date | Buyer | Sale Price | Title Company |
|---|---|---|---|
| John G Delorie Jr Lt | -- | None Available | |
| Delorie John G | -- | -- |
Source: Public Records
Mortgage History
| Date | Status | Borrower | Loan Amount |
|---|---|---|---|
| Previous Owner | Delorie John G | $377,000 | |
| Previous Owner | Delorie John G | $30,000 | |
| Previous Owner | Delorie John G | $86,000 |
Source: Public Records
Tax History
| Year | Tax Paid | Tax Assessment Tax Assessment Total Assessment is a certain percentage of the fair market value that is determined by local assessors to be the total taxable value of land and additions on the property. | Land | Improvement |
|---|---|---|---|---|
| 2025 | $8,240 | $711,000 | $307,100 | $403,900 |
| 2024 | $8,026 | $668,800 | $307,100 | $361,700 |
| 2023 | $7,775 | $616,100 | $279,500 | $336,600 |
| 2022 | $7,625 | $557,800 | $261,000 | $296,800 |
| 2021 | $7,066 | $502,200 | $228,400 | $273,800 |
| 2020 | $7,074 | $496,400 | $203,600 | $292,800 |
| 2019 | $6,826 | $483,400 | $203,600 | $279,800 |
| 2018 | $7,295 | $512,300 | $203,900 | $308,400 |
| 2017 | $7,173 | $503,400 | $199,900 | $303,500 |
| 2016 | $7,023 | $491,800 | $194,100 | $297,700 |
| 2015 | $6,868 | $458,500 | $186,700 | $271,800 |
| 2014 | $6,716 | $438,700 | $165,000 | $273,700 |
Source: Public Records
Map
Nearby Homes
- 483 Thurston St
- 25 Foxboro Rd
- 131 Washington St Unit 42
- 131 Washington St Unit 50
- 8 Conway Ln
- 75 Foxboro Rd
- 576 Dedham St
- 65 Foxboro Rd
- 10 Nature View Dr
- 15 Nature View Dr
- 8 Weber Farm Rd Unit 8
- 11 Weber Farm Rd Unit 11
- 30 Weber Farm Rd Unit 30
- 5 Post Rd
- 9 Sharon Ave
- 11 Sharon Ave
- 7 Hill St Unit 12
- 7 Hill St Unit 16
- 3 Earle Stewart Ln
- 2 Earle Stewart Ln
Your Personal Tour Guide
Ask me questions while you tour the home.