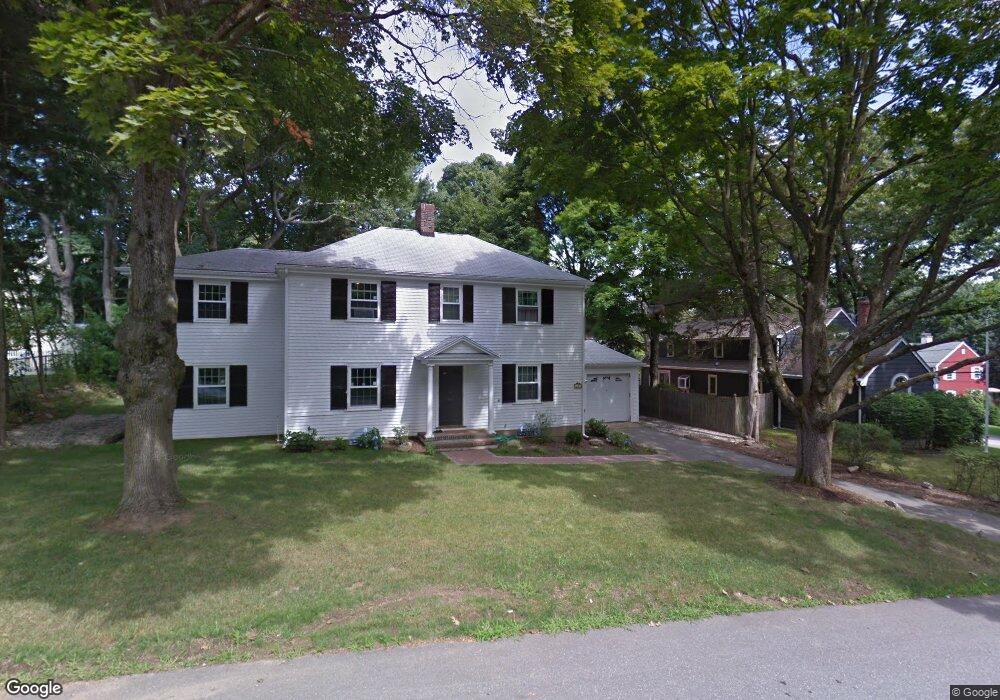
40 Preston Rd Lexington, MA 02420
North Lexington NeighborhoodEstimated Value: $1,376,000 - $1,528,000
3
Beds
2
Baths
2,116
Sq Ft
$681/Sq Ft
Est. Value
About This Home
This home is located at 40 Preston Rd, Lexington, MA 02420 and is currently estimated at $1,440,201, approximately $680 per square foot. 40 Preston Rd is a home located in Middlesex County with nearby schools including Joseph Estabrook Elementary School, William Diamond Middle School, and Lexington High School.
Ownership History
Date
Name
Owned For
Owner Type
Purchase Details
Closed on
Jul 20, 2018
Sold by
Narayanawamy Rajaram and Ramanathan Soumya R
Bought by
Woodruff Ft
Current Estimated Value
Home Financials for this Owner
Home Financials are based on the most recent Mortgage that was taken out on this home.
Original Mortgage
$550,000
Outstanding Balance
$476,657
Interest Rate
4.5%
Mortgage Type
New Conventional
Estimated Equity
$963,544
Purchase Details
Closed on
Oct 5, 2009
Sold by
Ma Kalil Nt
Bought by
Ramanathan Soumya and Narayanaswamy Rajaram
Home Financials for this Owner
Home Financials are based on the most recent Mortgage that was taken out on this home.
Original Mortgage
$523,700
Interest Rate
5.12%
Mortgage Type
Purchase Money Mortgage
Purchase Details
Closed on
Mar 8, 2006
Sold by
Kalil C Jeffrey and Kalil Marthur H
Bought by
Ma Kalil Nt
Create a Home Valuation Report for This Property
The Home Valuation Report is an in-depth analysis detailing your home's value as well as a comparison with similar homes in the area
Home Values in the Area
Average Home Value in this Area
Purchase History
| Date | Buyer | Sale Price | Title Company |
|---|---|---|---|
| Woodruff Ft | $880,000 | -- | |
| Ramanathan Soumya | $656,500 | -- | |
| Ma Kalil Nt | -- | -- |
Source: Public Records
Mortgage History
| Date | Status | Borrower | Loan Amount |
|---|---|---|---|
| Open | Woodruff Ft | $550,000 | |
| Previous Owner | Ramanathan Soumya | $523,700 |
Source: Public Records
Tax History Compared to Growth
Tax History
| Year | Tax Paid | Tax Assessment Tax Assessment Total Assessment is a certain percentage of the fair market value that is determined by local assessors to be the total taxable value of land and additions on the property. | Land | Improvement |
|---|---|---|---|---|
| 2025 | $15,129 | $1,237,000 | $676,000 | $561,000 |
| 2024 | $16,170 | $1,320,000 | $769,000 | $551,000 |
| 2023 | $15,808 | $1,216,000 | $699,000 | $517,000 |
| 2022 | $14,435 | $1,046,000 | $635,000 | $411,000 |
| 2021 | $13,613 | $946,000 | $579,000 | $367,000 |
| 2020 | $13,193 | $939,000 | $579,000 | $360,000 |
| 2019 | $12,652 | $896,000 | $552,000 | $344,000 |
| 2018 | $12,341 | $863,000 | $525,000 | $338,000 |
| 2017 | $11,056 | $763,000 | $514,000 | $249,000 |
| 2016 | $10,147 | $695,000 | $468,000 | $227,000 |
| 2015 | $9,822 | $661,000 | $425,000 | $236,000 |
| 2014 | $9,089 | $586,000 | $387,000 | $199,000 |
Source: Public Records
Map
Nearby Homes
- 101 Burlington St
- 3a Nowers Rd
- 25 Flintlock Rd
- 103 N Hancock St
- 125 Burlington St
- 18 Robinson Rd
- 17 Hamilton Rd
- 231 Bedford St
- 24 Vaille Ave
- 12 Coolidge Ave
- 36 Adams St
- 93 Bedford St Unit 201
- 93 Bedford St Unit 308
- 93 Bedford St Unit 101
- 45 Hancock St
- 3 Brown Rd
- 32 Edgewood Rd Unit 1
- 30 Meriam St Unit 30
- 18 Heritage Dr
- 83 Winter St