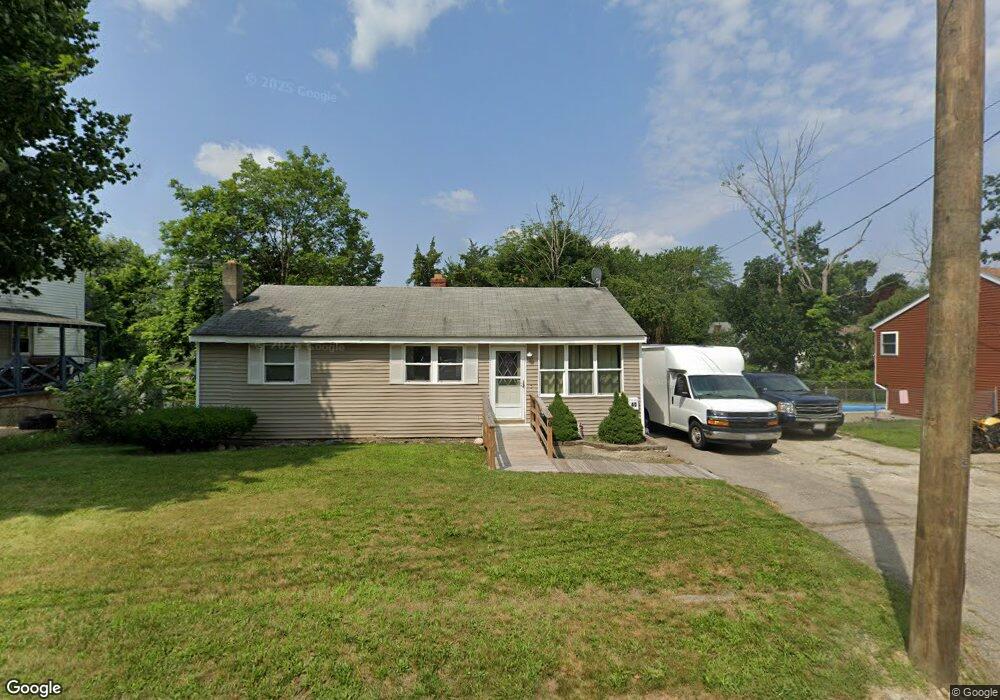
40 Prince St Brockton, MA 02302
Estimated Value: $422,000 - $473,000
3
Beds
1
Bath
1,056
Sq Ft
$425/Sq Ft
Est. Value
About This Home
This home is located at 40 Prince St, Brockton, MA 02302 and is currently estimated at $448,333, approximately $424 per square foot. 40 Prince St is a home located in Plymouth County with nearby schools including Brookfield Elementary School, Downey Elementary School, and Ashfield Middle School.
Ownership History
Date
Name
Owned For
Owner Type
Purchase Details
Closed on
Aug 20, 2021
Sold by
Lindelof Vernon
Bought by
Lindelof Brian A
Current Estimated Value
Purchase Details
Closed on
Aug 18, 2017
Sold by
Triple J Rt and Jordan
Bought by
Lindelof Vernon
Purchase Details
Closed on
Jun 16, 1995
Sold by
State Street B & T Co
Bought by
Jordan Charles E and Jordan Jean J
Purchase Details
Closed on
Jun 6, 1994
Sold by
Deangelo Philip A
Bought by
State St B&T Co Tr
Purchase Details
Closed on
Jun 28, 1988
Sold by
Gallagher Wade P
Bought by
Deanelo Philip
Home Financials for this Owner
Home Financials are based on the most recent Mortgage that was taken out on this home.
Original Mortgage
$95,900
Interest Rate
10.32%
Mortgage Type
Purchase Money Mortgage
Create a Home Valuation Report for This Property
The Home Valuation Report is an in-depth analysis detailing your home's value as well as a comparison with similar homes in the area
Home Values in the Area
Average Home Value in this Area
Purchase History
| Date | Buyer | Sale Price | Title Company |
|---|---|---|---|
| Lindelof Brian A | -- | None Available | |
| Lindelof Vernon | -- | -- | |
| Jordan Charles E | $32,500 | -- | |
| State St B&T Co Tr | $127,433 | -- | |
| State St B & T Co Tr | $127,433 | -- | |
| Deanelo Philip | $119,900 | -- |
Source: Public Records
Mortgage History
| Date | Status | Borrower | Loan Amount |
|---|---|---|---|
| Previous Owner | Deanelo Philip | $95,900 |
Source: Public Records
Tax History Compared to Growth
Tax History
| Year | Tax Paid | Tax Assessment Tax Assessment Total Assessment is a certain percentage of the fair market value that is determined by local assessors to be the total taxable value of land and additions on the property. | Land | Improvement |
|---|---|---|---|---|
| 2025 | $4,805 | $396,800 | $144,000 | $252,800 |
| 2024 | $4,731 | $393,600 | $144,000 | $249,600 |
| 2023 | $4,677 | $360,300 | $108,700 | $251,600 |
| 2022 | $4,398 | $314,800 | $98,700 | $216,100 |
| 2021 | $4,109 | $283,400 | $91,100 | $192,300 |
| 2020 | $3,831 | $252,900 | $87,500 | $165,400 |
| 2019 | $3,655 | $235,200 | $80,900 | $154,300 |
| 2018 | $3,291 | $212,400 | $80,900 | $131,500 |
| 2017 | $3,291 | $204,400 | $80,900 | $123,500 |
| 2016 | $3,179 | $183,100 | $77,100 | $106,000 |
| 2015 | $2,837 | $156,300 | $77,100 | $79,200 |
| 2014 | $2,973 | $164,000 | $77,100 | $86,900 |
Source: Public Records
Map
Nearby Homes