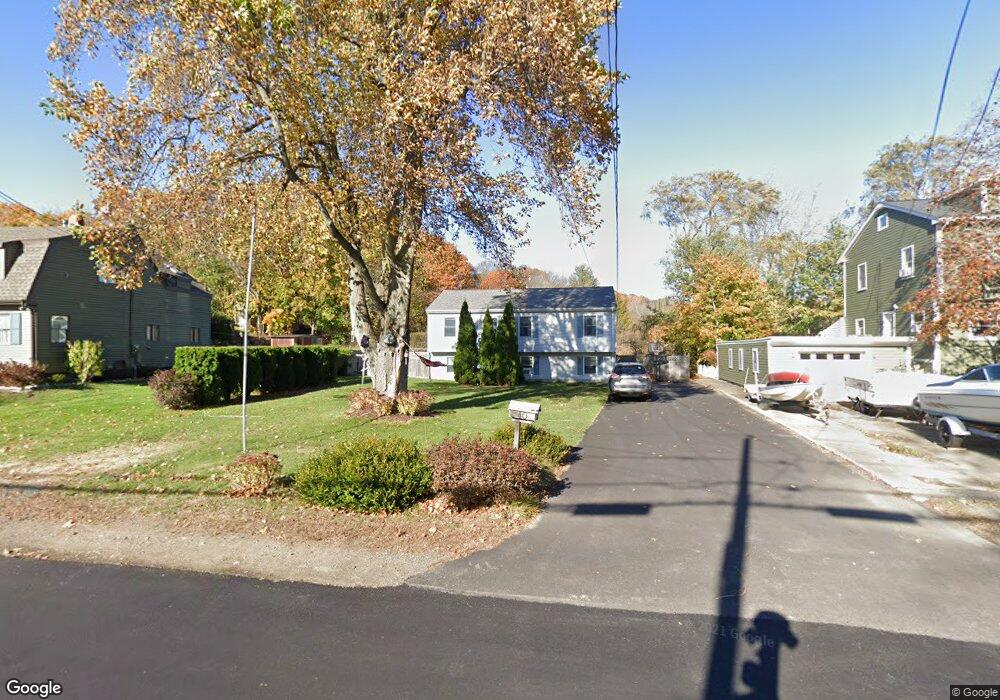
40 Reynard St Gloucester, MA 01930
Estimated Value: $714,904 - $856,000
3
Beds
2
Baths
1,900
Sq Ft
$409/Sq Ft
Est. Value
About This Home
This home is located at 40 Reynard St, Gloucester, MA 01930 and is currently estimated at $777,726, approximately $409 per square foot. 40 Reynard St is a home located in Essex County with nearby schools including Beeman Memorial, Ralph B O'maley Middle School, and Gloucester High School.
Ownership History
Date
Name
Owned For
Owner Type
Purchase Details
Closed on
Oct 19, 2022
Sold by
Kasera Elizabeth G and Kasera John V
Bought by
Kasera John V
Current Estimated Value
Home Financials for this Owner
Home Financials are based on the most recent Mortgage that was taken out on this home.
Original Mortgage
$206,000
Outstanding Balance
$197,717
Interest Rate
6.02%
Mortgage Type
New Conventional
Estimated Equity
$580,009
Purchase Details
Closed on
Nov 4, 2010
Sold by
Meuse Joshua J and Meuse Kristen A
Bought by
Kasera John and Kasera Elizabeth G
Home Financials for this Owner
Home Financials are based on the most recent Mortgage that was taken out on this home.
Original Mortgage
$277,600
Interest Rate
4.41%
Mortgage Type
Purchase Money Mortgage
Purchase Details
Closed on
Sep 25, 2001
Sold by
Cecilio Marc A
Bought by
Meuse Joshua J and Meuse Kristen A
Purchase Details
Closed on
Feb 27, 1996
Sold by
Burns William E and Burns Marilyn
Bought by
Cecilio Marc A and Cecilio Desiree
Purchase Details
Closed on
Jan 6, 1995
Sold by
Burns Christine and Burns Kevin
Bought by
Burns William E and Burns Marilyn
Create a Home Valuation Report for This Property
The Home Valuation Report is an in-depth analysis detailing your home's value as well as a comparison with similar homes in the area
Purchase History
| Date | Buyer | Sale Price | Title Company |
|---|---|---|---|
| Kasera John V | -- | None Available | |
| Kasera John V | -- | None Available | |
| Kasera John V | -- | None Available | |
| Kasera John | $347,000 | -- | |
| Meuse Joshua J | $265,000 | -- | |
| Cecilio Marc A | $139,900 | -- | |
| Burns William E | $35,000 | -- | |
| Kasera John V | $347,000 | -- | |
| Meuse Joshua J | $265,000 | -- | |
| Cecilio Marc A | $139,900 | -- | |
| Burns William E | $35,000 | -- |
Source: Public Records
Mortgage History
| Date | Status | Borrower | Loan Amount |
|---|---|---|---|
| Open | Kasera John V | $206,000 | |
| Closed | Kasera John V | $206,000 | |
| Previous Owner | Burns William E | $277,600 |
Source: Public Records
Tax History
| Year | Tax Paid | Tax Assessment Tax Assessment Total Assessment is a certain percentage of the fair market value that is determined by local assessors to be the total taxable value of land and additions on the property. | Land | Improvement |
|---|---|---|---|---|
| 2025 | $5,478 | $563,600 | $185,000 | $378,600 |
| 2024 | $5,674 | $583,100 | $176,100 | $407,000 |
| 2023 | $5,349 | $505,100 | $157,300 | $347,800 |
| 2022 | $4,990 | $425,400 | $136,800 | $288,600 |
| 2021 | $4,891 | $393,200 | $124,300 | $268,900 |
| 2020 | $4,667 | $378,500 | $124,300 | $254,200 |
| 2019 | $4,695 | $370,000 | $124,300 | $245,700 |
| 2018 | $4,419 | $341,800 | $124,300 | $217,500 |
| 2017 | $4,168 | $316,000 | $118,400 | $197,600 |
| 2016 | $4,132 | $303,600 | $123,600 | $180,000 |
| 2015 | $3,952 | $289,500 | $123,600 | $165,900 |
Source: Public Records
Map
Nearby Homes
- 31 Echo Ave
- 457 Washington St Unit 2
- 13 Honeysuckle Rd
- 8 Mystic Ave
- 3 Rockland St
- 6 Monroe Ct
- 9 Cleveland Place
- 2 Breezy Point Rd
- 40 Sargent St
- 50 Warner St
- 33 Maplewood Ave Unit 310
- 113 Pleasant St
- 15 Harvard St
- 120 Washington St
- 20 Beacon St
- 20 Beacon St Unit 2
- 20 Beacon St Unit 1
- 23 Mount Vernon St
- 672 Washington St
- 14R Spring St Unit 3
Your Personal Tour Guide
Ask me questions while you tour the home.