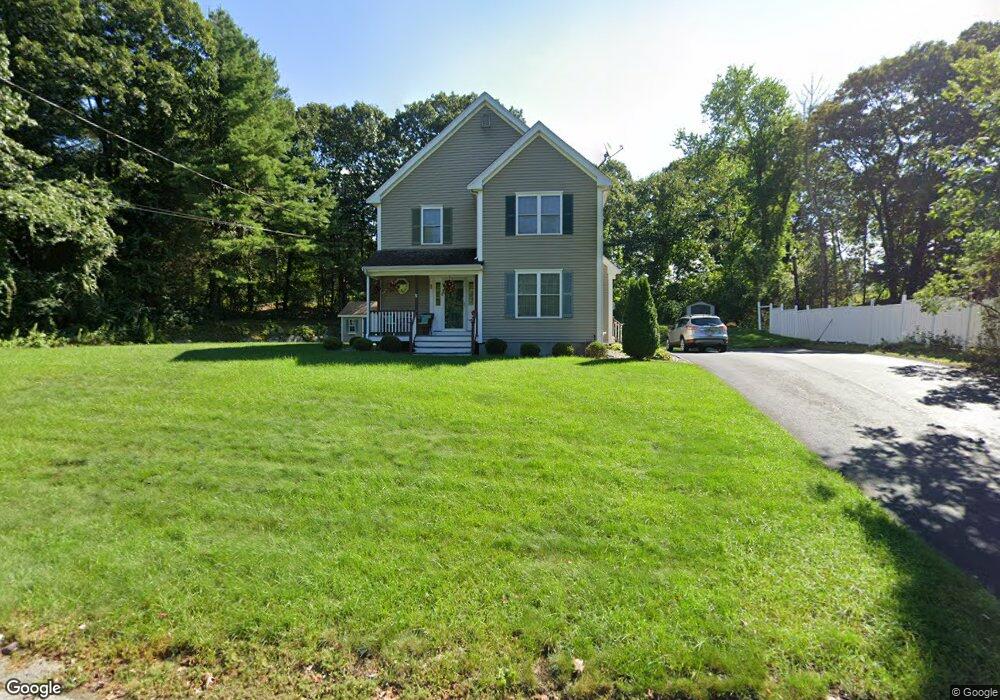
40 Riverside Dr Wrentham, MA 02093
Estimated Value: $463,000 - $661,000
2
Beds
2
Baths
1,568
Sq Ft
$384/Sq Ft
Est. Value
About This Home
This home is located at 40 Riverside Dr, Wrentham, MA 02093 and is currently estimated at $601,843, approximately $383 per square foot. 40 Riverside Dr is a home located in Norfolk County with nearby schools including Delaney Elementary School and Charles E Roderick.
Ownership History
Date
Name
Owned For
Owner Type
Purchase Details
Closed on
Jul 23, 2004
Sold by
Dmc Rt
Bought by
Mckearney Alba and Mckearney James P
Current Estimated Value
Home Financials for this Owner
Home Financials are based on the most recent Mortgage that was taken out on this home.
Original Mortgage
$287,500
Outstanding Balance
$143,173
Interest Rate
6.28%
Mortgage Type
Purchase Money Mortgage
Estimated Equity
$458,670
Create a Home Valuation Report for This Property
The Home Valuation Report is an in-depth analysis detailing your home's value as well as a comparison with similar homes in the area
Purchase History
| Date | Buyer | Sale Price | Title Company |
|---|---|---|---|
| Mckearney Alba | $287,500 | -- |
Source: Public Records
Mortgage History
| Date | Status | Borrower | Loan Amount |
|---|---|---|---|
| Open | Mckearney Alba | $287,500 |
Source: Public Records
Tax History
| Year | Tax Paid | Tax Assessment Tax Assessment Total Assessment is a certain percentage of the fair market value that is determined by local assessors to be the total taxable value of land and additions on the property. | Land | Improvement |
|---|---|---|---|---|
| 2025 | $6,789 | $585,800 | $308,800 | $277,000 |
| 2024 | $6,596 | $549,700 | $308,800 | $240,900 |
| 2023 | $6,280 | $497,600 | $280,700 | $216,900 |
| 2022 | $5,981 | $437,500 | $255,200 | $182,300 |
| 2021 | $5,947 | $422,700 | $255,200 | $167,500 |
| 2020 | $5,740 | $402,800 | $209,800 | $193,000 |
| 2019 | $5,562 | $393,900 | $209,800 | $184,100 |
| 2018 | $5,424 | $380,900 | $209,900 | $171,000 |
| 2017 | $5,140 | $360,700 | $205,900 | $154,800 |
| 2016 | $5,022 | $351,700 | $199,900 | $151,800 |
| 2015 | $4,901 | $327,200 | $192,200 | $135,000 |
| 2014 | $4,841 | $316,200 | $184,800 | $131,400 |
Source: Public Records
Map
Nearby Homes
- Lot 1 - Blueberry 2 Car Plan at King Philip Estates
- Lot 8 - Blueberry 2 Car Plan at King Philip Estates
- Lot 5 - Hughes 2 car Plan at King Philip Estates
- Lot 6 - Blueberry 3 Car Plan at King Philip Estates
- 10 Earle Stewart Ln Unit Lot 5
- Lot 2 - Camden 2 Car Plan at King Philip Estates
- Lot 7 - Cedar Plan at King Philip Estates
- Lot 4 - Hemingway 2 Car Plan at King Philip Estates
- Lot 3 - Blueberry 2 Car Plan at King Philip Estates
- 12 Earle Stewart Ln
- Loty 3-14 Earle Stewart Ln
- 11 Earle Stewart Ln
- 319 Taunton St
- 440 Chestnut St
- 613 West St
- 1222 South St
- 10 Nature View Dr
- 15 Nature View Dr
- 500 Franklin St
- 955 Summer St
Your Personal Tour Guide
Ask me questions while you tour the home.