Estimated Value: $483,000 - $550,217
3
Beds
1
Bath
952
Sq Ft
$551/Sq Ft
Est. Value
About This Home
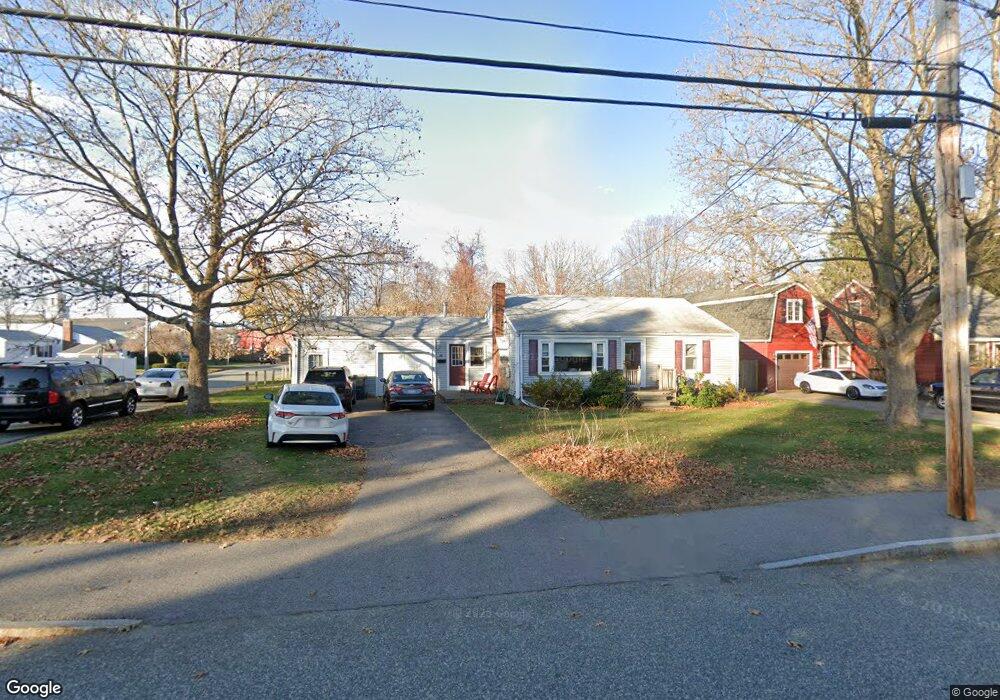
This home is located at 40 Robbins St, Avon, MA 02322 and is currently estimated at $524,554, approximately $551 per square foot. 40 Robbins St is a home located in Norfolk County with nearby schools including Ralph D. Butler Elementary School and Avon Middle/High School.
Ownership History
Date
Name
Owned For
Owner Type
Purchase Details
Closed on
Nov 30, 1995
Sold by
Rakutis Paul W
Bought by
Miller Anne M
Current Estimated Value
Home Financials for this Owner
Home Financials are based on the most recent Mortgage that was taken out on this home.
Original Mortgage
$103,500
Interest Rate
7.37%
Mortgage Type
Purchase Money Mortgage
Create a Home Valuation Report for This Property
The Home Valuation Report is an in-depth analysis detailing your home's value as well as a comparison with similar homes in the area
Home Values in the Area
Average Home Value in this Area
Purchase History
| Date | Buyer | Sale Price | Title Company |
|---|---|---|---|
| Miller Anne M | $125,000 | -- |
Source: Public Records
Mortgage History
| Date | Status | Borrower | Loan Amount |
|---|---|---|---|
| Open | Miller Anne M | $113,000 | |
| Closed | Miller Anne M | $103,500 | |
| Closed | Miller Anne M | $103,500 |
Source: Public Records
Tax History
| Year | Tax Paid | Tax Assessment Tax Assessment Total Assessment is a certain percentage of the fair market value that is determined by local assessors to be the total taxable value of land and additions on the property. | Land | Improvement |
|---|---|---|---|---|
| 2025 | $57 | $426,400 | $184,100 | $242,300 |
| 2024 | $5,247 | $374,000 | $174,500 | $199,500 |
| 2023 | $5,094 | $374,000 | $174,500 | $199,500 |
| 2022 | $5,179 | $327,600 | $145,500 | $182,100 |
| 2021 | $4,724 | $281,500 | $132,000 | $149,500 |
| 2020 | $5,080 | $287,000 | $129,400 | $157,600 |
| 2019 | $4,625 | $257,100 | $129,400 | $127,700 |
| 2018 | $4,708 | $253,800 | $129,400 | $124,400 |
| 2017 | $4,139 | $239,500 | $129,400 | $110,100 |
| 2016 | $4,189 | $244,800 | $129,400 | $115,400 |
| 2015 | $3,731 | $227,900 | $117,600 | $110,300 |
Source: Public Records
Map
Nearby Homes