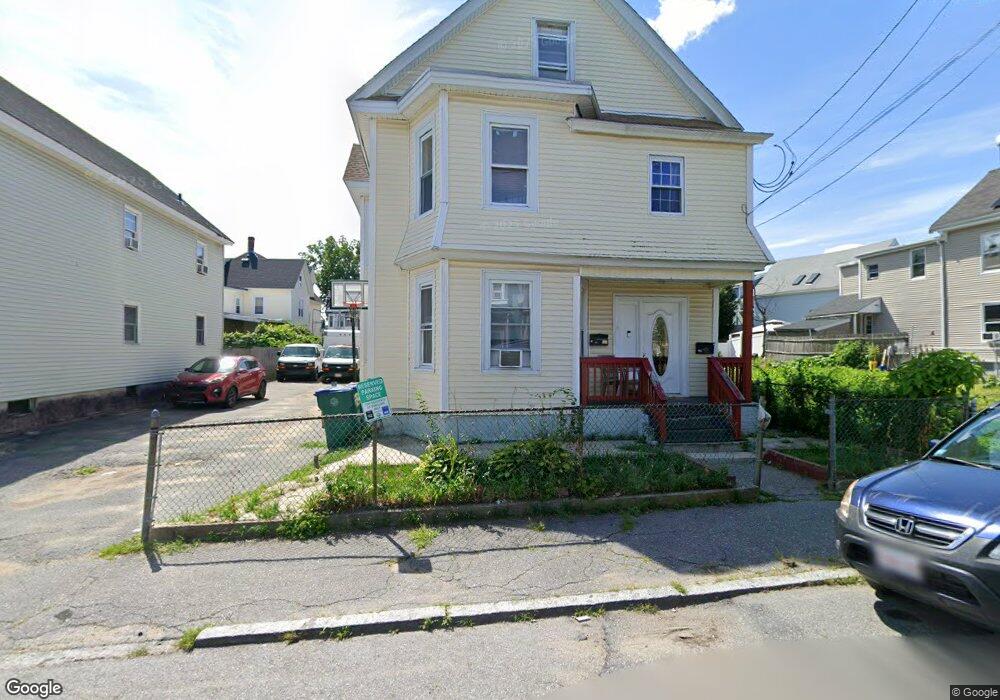
40 Royal St Lowell, MA 01851
Lower Highlands NeighborhoodEstimated Value: $729,141 - $874,000
10
Beds
2
Baths
4,222
Sq Ft
$191/Sq Ft
Est. Value
About This Home
This home is located at 40 Royal St, Lowell, MA 01851 and is currently estimated at $806,035, approximately $190 per square foot. 40 Royal St is a home located in Middlesex County with nearby schools including Abraham Lincoln Elementary School, Charles W. Morey Elementary School, and Charlotte M. Murkland Elementary School.
Ownership History
Date
Name
Owned For
Owner Type
Purchase Details
Closed on
Jun 25, 2024
Sold by
Ngyuyen Hoang T
Bought by
40 Royal Street T and 40 Ngyuyen
Current Estimated Value
Purchase Details
Closed on
Oct 25, 2022
Sold by
Nguyen Hoang T and Nguyen Ha N
Bought by
Nguyen Hoang T
Purchase Details
Closed on
Nov 27, 2013
Sold by
Nguyen Kenny
Bought by
Nguyen Hoang T and Nguyen Ha N
Home Financials for this Owner
Home Financials are based on the most recent Mortgage that was taken out on this home.
Original Mortgage
$194,250
Interest Rate
4.29%
Mortgage Type
New Conventional
Purchase Details
Closed on
Sep 30, 2009
Sold by
Ngeth Peter and Keo Samneang
Bought by
Nguyen Kenny
Purchase Details
Closed on
Apr 10, 2009
Sold by
Us Bk
Bought by
Ngeth Peter and Keo Samneang
Purchase Details
Closed on
Nov 5, 2008
Sold by
Nuth Buntham and Us Bk
Bought by
Us Bk
Purchase Details
Closed on
Sep 10, 2004
Sold by
Nuth Buntham and Sok Heng
Bought by
Nuth Buntham
Purchase Details
Closed on
Nov 30, 1999
Sold by
Nguyen Tu Ngoc and Nguyen The Thi Li
Bought by
Chhen Rann and Eung Kim T
Purchase Details
Closed on
Feb 14, 1995
Sold by
Kassin John H and Ociepka William
Bought by
Nguyen Tu Ngoc and Nguyen The Thi Le
Purchase Details
Closed on
Sep 27, 1994
Sold by
Ascensao Antonio and Shawmut Bank
Bought by
Kassin John H and Ociepka William
Create a Home Valuation Report for This Property
The Home Valuation Report is an in-depth analysis detailing your home's value as well as a comparison with similar homes in the area
Home Values in the Area
Average Home Value in this Area
Purchase History
| Date | Buyer | Sale Price | Title Company |
|---|---|---|---|
| 40 Royal Street T | -- | None Available | |
| 40 Royal Street T | -- | None Available | |
| Nguyen Hoang T | -- | None Available | |
| Nguyen Hoang T | -- | None Available | |
| Nguyen Hoang T | $259,000 | -- | |
| Nguyen Hoang T | $259,000 | -- | |
| Nguyen Hoang T | $259,000 | -- | |
| Nguyen Kenny | $273,000 | -- | |
| Nguyen Kenny | $273,000 | -- | |
| Nguyen Kenny | $273,000 | -- | |
| Ngeth Peter | $156,000 | -- | |
| Ngeth Peter | $156,000 | -- | |
| Ngeth Peter | $156,000 | -- | |
| Us Bk | $178,500 | -- | |
| Us Bk | $178,500 | -- | |
| Us Bk | $178,500 | -- | |
| Nuth Buntham | -- | -- | |
| Nuth Buntham | -- | -- | |
| Nuth Buntham | -- | -- | |
| Chhen Rann | $130,000 | -- | |
| Chhen Rann | $130,000 | -- | |
| Nguyen Tu Ngoc | $80,000 | -- | |
| Nguyen Tu Ngoc | $80,000 | -- | |
| Kassin John H | $28,000 | -- | |
| Kassin John H | $28,000 | -- |
Source: Public Records
Mortgage History
| Date | Status | Borrower | Loan Amount |
|---|---|---|---|
| Previous Owner | Nguyen Hoang T | $194,250 |
Source: Public Records
Tax History
| Year | Tax Paid | Tax Assessment Tax Assessment Total Assessment is a certain percentage of the fair market value that is determined by local assessors to be the total taxable value of land and additions on the property. | Land | Improvement |
|---|---|---|---|---|
| 2025 | $8,784 | $765,200 | $116,300 | $648,900 |
| 2024 | $8,119 | $681,700 | $108,700 | $573,000 |
| 2023 | $7,565 | $609,100 | $94,500 | $514,600 |
| 2022 | $6,849 | $539,700 | $74,700 | $465,000 |
| 2021 | $6,346 | $471,500 | $64,900 | $406,600 |
| 2020 | $5,870 | $439,400 | $64,900 | $374,500 |
| 2019 | $5,205 | $370,700 | $61,800 | $308,900 |
| 2018 | $4,821 | $335,000 | $58,800 | $276,200 |
| 2017 | $4,606 | $308,700 | $57,000 | $251,700 |
| 2016 | $4,619 | $304,700 | $53,000 | $251,700 |
| 2015 | $4,211 | $272,000 | $53,000 | $219,000 |
| 2013 | $3,825 | $254,800 | $63,500 | $191,300 |
Source: Public Records
Map
Nearby Homes
- 45 Marshall St
- 68 Smith St
- 42 Branch St
- 201 Thorndike St Unit 501
- 201 Thorndike St Unit 2-312
- 201 Thorndike St Unit 505
- 15 Barclay St
- 191 Thorndike St Unit 26
- 84 Cambridge St
- 3 Butman Place
- 95 S Highland St
- 491 Dutton St Unit 305
- 491 Dutton St Unit 409
- 491 Dutton St Unit 504
- 710 School St
- 18 Burgess St
- 278-316 Middlesex St
- 8 Cedar Ct
- 7 Butler Ave Unit 5
- 19 Lawton St
Your Personal Tour Guide
Ask me questions while you tour the home.