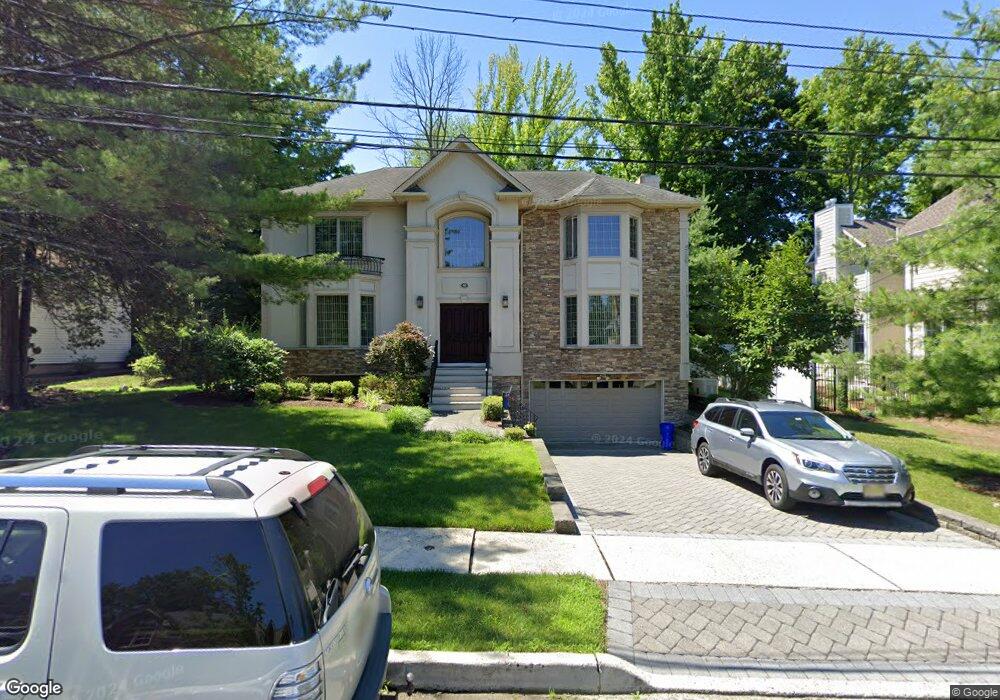
40 Rutgers St Closter, NJ 07624
Estimated Value: $1,483,796 - $1,904,000
--
Bed
--
Bath
2,640
Sq Ft
$621/Sq Ft
Est. Value
About This Home
This home is located at 40 Rutgers St, Closter, NJ 07624 and is currently estimated at $1,638,449, approximately $620 per square foot. 40 Rutgers St is a home located in Bergen County with nearby schools including Hillside Elementary School, Tenakill Middle School, and Northern Valley Regional High School at Demarest.
Ownership History
Date
Name
Owned For
Owner Type
Purchase Details
Closed on
May 2, 2011
Sold by
M And R Developement Llc
Bought by
Layvand Dmitrity and Layvand Marina
Current Estimated Value
Home Financials for this Owner
Home Financials are based on the most recent Mortgage that was taken out on this home.
Original Mortgage
$416,950
Outstanding Balance
$289,761
Interest Rate
4.88%
Mortgage Type
Purchase Money Mortgage
Estimated Equity
$1,348,688
Purchase Details
Closed on
Jul 6, 2006
Sold by
Roman George P
Bought by
M R Development Llc
Home Financials for this Owner
Home Financials are based on the most recent Mortgage that was taken out on this home.
Original Mortgage
$360,000
Interest Rate
6.67%
Purchase Details
Closed on
Jan 16, 1998
Sold by
Roman George P and Roman Kathleen
Bought by
Roman George P and Roman Kathleen
Create a Home Valuation Report for This Property
The Home Valuation Report is an in-depth analysis detailing your home's value as well as a comparison with similar homes in the area
Home Values in the Area
Average Home Value in this Area
Purchase History
| Date | Buyer | Sale Price | Title Company |
|---|---|---|---|
| Layvand Dmitrity | $999,000 | -- | |
| M R Development Llc | $480,000 | -- | |
| Roman George P | -- | -- |
Source: Public Records
Mortgage History
| Date | Status | Borrower | Loan Amount |
|---|---|---|---|
| Open | Layvand Dmitrity | $416,950 | |
| Previous Owner | M R Development Llc | $360,000 |
Source: Public Records
Tax History Compared to Growth
Tax History
| Year | Tax Paid | Tax Assessment Tax Assessment Total Assessment is a certain percentage of the fair market value that is determined by local assessors to be the total taxable value of land and additions on the property. | Land | Improvement |
|---|---|---|---|---|
| 2025 | $22,491 | $1,113,600 | $552,700 | $560,900 |
| 2024 | $22,315 | $1,062,900 | $530,200 | $532,700 |
| 2023 | $21,631 | $1,040,800 | $505,200 | $535,600 |
| 2022 | $21,631 | $977,900 | $467,800 | $510,100 |
| 2021 | $21,559 | $935,700 | $447,800 | $487,900 |
| 2020 | $21,108 | $941,900 | $450,300 | $491,600 |
| 2019 | $20,625 | $930,300 | $442,800 | $487,500 |
| 2018 | $20,388 | $915,900 | $435,800 | $480,100 |
| 2017 | $21,533 | $943,600 | $416,000 | $527,600 |
| 2016 | $21,127 | $943,600 | $416,000 | $527,600 |
| 2015 | $20,665 | $943,600 | $416,000 | $527,600 |
| 2014 | $20,089 | $943,600 | $416,000 | $527,600 |
Source: Public Records
Map
Nearby Homes
- 77 Rutgers St
- 2 Eisenhower Rd
- 25 Piermont Rd
- 358 Ruckman Rd
- 90 Dyer Ct
- 75 Susan Dr
- 305 Westwind Ct
- 54 Mohawk Ave
- 304 Piermont Rd
- 84 Briarwood Ave
- 215 Beech Ct Unit T046
- 216 Beech Ct
- 814 Hemlock Ct
- 186 Hickory Ln
- 8 Church Ct
- 844 Hemlock Ct Unit T169
- 36 Buckingham Dr
- 125 Livingston St
- 28 Buckingham Dr
- 100 Johnson Ct