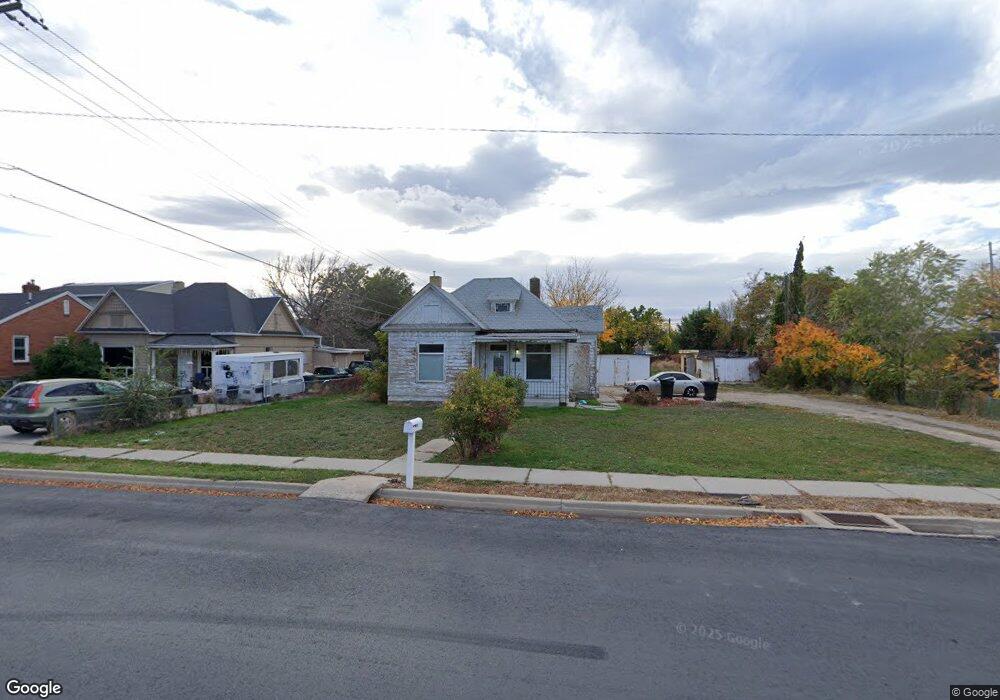
40 S 200 W Unit 1 Spanish Fork, UT 84660
Estimated Value: $330,000 - $362,000
3
Beds
1
Bath
820
Sq Ft
$423/Sq Ft
Est. Value
About This Home
This home is located at 40 S 200 W Unit 1, Spanish Fork, UT 84660 and is currently estimated at $346,467, approximately $422 per square foot. 40 S 200 W Unit 1 is a home located in Utah County with nearby schools including Brockbank Elementary School, Spanish Fork Jr High School, and Spanish Fork High School.
Ownership History
Date
Name
Owned For
Owner Type
Purchase Details
Closed on
Nov 29, 2018
Sold by
Cope Tyler
Bought by
Cope Tyler V and Cope Jackeline Santiago
Current Estimated Value
Purchase Details
Closed on
Aug 18, 2006
Sold by
Kelley Heather and Pinegar Michael C
Bought by
Cope Tyler and Acuna Robert
Home Financials for this Owner
Home Financials are based on the most recent Mortgage that was taken out on this home.
Original Mortgage
$120,000
Outstanding Balance
$72,046
Interest Rate
6.76%
Mortgage Type
Credit Line Revolving
Estimated Equity
$274,421
Create a Home Valuation Report for This Property
The Home Valuation Report is an in-depth analysis detailing your home's value as well as a comparison with similar homes in the area
Home Values in the Area
Average Home Value in this Area
Purchase History
| Date | Buyer | Sale Price | Title Company |
|---|---|---|---|
| Cope Tyler V | -- | None Available | |
| Cope Tyler | -- | Utah Standard Title |
Source: Public Records
Mortgage History
| Date | Status | Borrower | Loan Amount |
|---|---|---|---|
| Open | Cope Tyler | $120,000 |
Source: Public Records
Tax History Compared to Growth
Tax History
| Year | Tax Paid | Tax Assessment Tax Assessment Total Assessment is a certain percentage of the fair market value that is determined by local assessors to be the total taxable value of land and additions on the property. | Land | Improvement |
|---|---|---|---|---|
| 2025 | $1,330 | $154,440 | $141,900 | $138,900 |
| 2024 | $1,330 | $137,115 | $0 | $0 |
| 2023 | $1,308 | $134,970 | $0 | $0 |
| 2022 | $1,510 | $152,845 | $0 | $0 |
| 2021 | $1,248 | $202,000 | $82,300 | $119,700 |
| 2020 | $1,121 | $176,400 | $68,600 | $107,800 |
| 2019 | $980 | $162,300 | $68,600 | $93,700 |
| 2018 | $938 | $150,100 | $68,600 | $81,500 |
| 2017 | $817 | $70,290 | $0 | $0 |
| 2016 | $702 | $59,565 | $0 | $0 |
| 2015 | $672 | $56,375 | $0 | $0 |
| 2014 | $628 | $52,910 | $0 | $0 |
Source: Public Records
Map
Nearby Homes
- 42 W 200 S
- 225 W 300 S
- 88 S 400 W
- 134 N 300 W
- 324 S St Unit 204
- 298 S St Unit 205
- 325 S St Unit 203
- 294 W 200 N
- 161 S 100 E
- 844 S 200 E Unit 4 -201
- 844 S 200 E Unit 304
- 844 S 200 E Unit 4-204
- 103 E 400 S
- 13 N 710 W
- 351 W 530 S
- 1788 N 630 St W Unit 47
- 1826 N 630 St W Unit 101
- 143 E 200 N
- 2645 W 360 S Unit 1
- 2576 W 360 S Unit 5