Estimated Value: $122,429 - $161,000
2
Beds
1
Bath
1,044
Sq Ft
$137/Sq Ft
Est. Value
About This Home
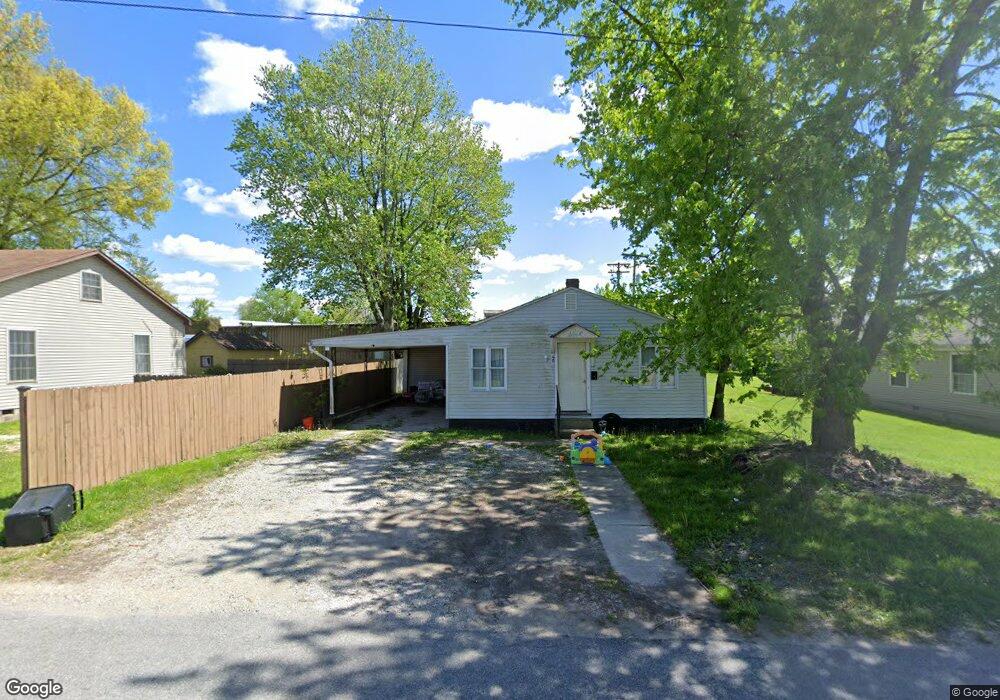
This home is located at 40 S Grove St, Pekin, IN 47165 and is currently estimated at $142,607, approximately $136 per square foot. 40 S Grove St is a home located in Washington County with nearby schools including East Washington Elementary School, East Washington Middle School, and Eastern High School.
Ownership History
Date
Name
Owned For
Owner Type
Purchase Details
Closed on
Nov 23, 2016
Sold by
K&E Land Llc
Bought by
Future Development Llc
Current Estimated Value
Purchase Details
Closed on
Dec 2, 2011
Sold by
Rusby Eric P
Bought by
K & E Land Llc
Purchase Details
Closed on
Mar 14, 2011
Sold by
Secretary Of Hud Of Washinton Dc
Bought by
Rusby Eric P
Purchase Details
Closed on
Nov 17, 2010
Sold by
Fifth Third Mortgage Co
Bought by
Secretary Of Hud
Purchase Details
Closed on
Oct 19, 2010
Sold by
Westfall Patricia A and Capital One Bank Was Defendent
Bought by
Fifth Third Mortgage Co
Purchase Details
Closed on
Mar 12, 2007
Sold by
Brough Darren R and Brough Angela A
Bought by
Westfall Patricia A
Home Financials for this Owner
Home Financials are based on the most recent Mortgage that was taken out on this home.
Original Mortgage
$54,150
Interest Rate
6.27%
Mortgage Type
FHA
Create a Home Valuation Report for This Property
The Home Valuation Report is an in-depth analysis detailing your home's value as well as a comparison with similar homes in the area
Home Values in the Area
Average Home Value in this Area
Purchase History
| Date | Buyer | Sale Price | Title Company |
|---|---|---|---|
| Future Development Llc | $15,000 | -- | |
| K & E Land Llc | -- | None Available | |
| Rusby Eric P | -- | None Available | |
| Secretary Of Hud | -- | None Available | |
| Fifth Third Mortgage Co | -- | None Available | |
| Westfall Patricia A | -- | None Available |
Source: Public Records
Mortgage History
| Date | Status | Borrower | Loan Amount |
|---|---|---|---|
| Previous Owner | Westfall Patricia A | $54,150 |
Source: Public Records
Tax History Compared to Growth
Tax History
| Year | Tax Paid | Tax Assessment Tax Assessment Total Assessment is a certain percentage of the fair market value that is determined by local assessors to be the total taxable value of land and additions on the property. | Land | Improvement |
|---|---|---|---|---|
| 2024 | $996 | $49,800 | $5,700 | $44,100 |
| 2023 | $946 | $47,300 | $5,700 | $41,600 |
| 2022 | $754 | $37,700 | $5,700 | $32,000 |
| 2021 | $704 | $35,200 | $5,700 | $29,500 |
| 2020 | $642 | $32,100 | $2,600 | $29,500 |
| 2019 | $636 | $31,800 | $2,600 | $29,200 |
| 2018 | $606 | $30,300 | $2,600 | $27,700 |
| 2017 | $672 | $33,600 | $2,600 | $31,000 |
| 2016 | $585 | $33,300 | $2,600 | $30,700 |
| 2014 | $1,048 | $52,400 | $14,300 | $38,100 |
| 2013 | $938 | $46,900 | $5,700 | $41,200 |
Source: Public Records
Map
Nearby Homes
- 520 E Main St
- 530 E Main St
- 341 S 3rd St
- 800 N Blue River Rd
- 6872 E Hurst Rd
- off E Hurst Rd
- 0 E Hurst Rd
- 1188 N Renee Ct
- E Unit WP001
- 7651 S Old Palmyra Rd
- 6183 E Motsinger Rd
- 8369 S Old Palmyra Rd
- 2980 E Banet Rd
- 4592 S Old 60
- 22106 Daisy Hill Rd
- 9916 S Voyles Rd
- 8807 E Lost College Rd
- 9927 Maplewood Ct
- 798 E Brown Rd
- 10484 S State Road 335
- 34 S Grove St
- 50 S Grove St
- 50 S Grove St
- 21 Grove St
- 40 S Water St
- 16 S Grove St
- 489 E Main St
- 16 S Water St
- 16 S Water St
- 423 E Main St
- 27 S Water St
- 50 S Water St
- 510 E Main St
- 561 E Main St
- 0 S of Blue River Rd Unit 201601109
- 0 S of Blue River Rd Unit 202107955
- 460 E Main St
- 593 E Main St
- 108 S Grade St
- 540 E Main St