40 Smith St Middleboro, MA 02346
Estimated Value: $514,000 - $600,000
3
Beds
2
Baths
1,510
Sq Ft
$363/Sq Ft
Est. Value
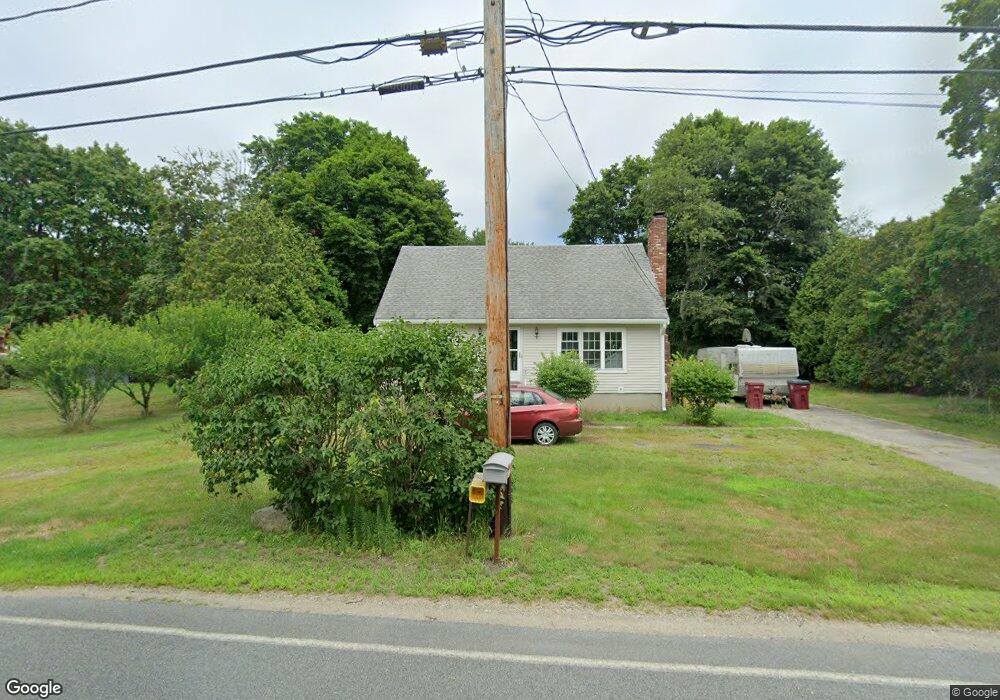
About This Home
This home is located at 40 Smith St, Middleboro, MA 02346 and is currently estimated at $548,115, approximately $362 per square foot. 40 Smith St is a home located in Plymouth County with nearby schools including Mary K. Goode Elementary School and Samuel Fuller School.
Ownership History
Date
Name
Owned For
Owner Type
Purchase Details
Closed on
Dec 12, 2022
Sold by
Thomson Carolyn
Bought by
Thomson Ft
Current Estimated Value
Purchase Details
Closed on
May 6, 2022
Sold by
Thomson Robert K and Thomson Carolyn
Bought by
Thomson Carolyn
Purchase Details
Closed on
May 24, 1973
Bought by
Thomson Robert and Thomson Carolyn
Create a Home Valuation Report for This Property
The Home Valuation Report is an in-depth analysis detailing your home's value as well as a comparison with similar homes in the area
Home Values in the Area
Average Home Value in this Area
Purchase History
| Date | Buyer | Sale Price | Title Company |
|---|---|---|---|
| Thomson Ft | -- | None Available | |
| Thomson Carolyn | -- | None Available | |
| Thomson Robert | -- | -- |
Source: Public Records
Mortgage History
| Date | Status | Borrower | Loan Amount |
|---|---|---|---|
| Previous Owner | Thomson Robert | $30,000 | |
| Previous Owner | Thomson Robert | $130,000 | |
| Previous Owner | Thomson Robert | $25,000 | |
| Previous Owner | Thomson Robert | $80,000 |
Source: Public Records
Tax History
| Year | Tax Paid | Tax Assessment Tax Assessment Total Assessment is a certain percentage of the fair market value that is determined by local assessors to be the total taxable value of land and additions on the property. | Land | Improvement |
|---|---|---|---|---|
| 2025 | $5,769 | $430,200 | $187,700 | $242,500 |
| 2024 | $5,578 | $412,000 | $179,700 | $232,300 |
| 2023 | $5,666 | $397,900 | $179,700 | $218,200 |
| 2022 | $5,182 | $336,900 | $158,100 | $178,800 |
| 2021 | $5,140 | $315,900 | $140,500 | $175,400 |
| 2020 | $4,810 | $302,900 | $140,500 | $162,400 |
| 2019 | $4,415 | $285,200 | $140,500 | $144,700 |
| 2018 | $4,368 | $280,000 | $134,300 | $145,700 |
| 2017 | $4,293 | $272,200 | $129,700 | $142,500 |
| 2016 | $3,948 | $248,000 | $123,700 | $124,300 |
| 2015 | $3,879 | $245,800 | $124,400 | $121,400 |
Source: Public Records
Map
Nearby Homes
- 480 Wareham St
- Rear Wareham St
- 441 Wareham St
- 386 Wareham St
- 425 Wareham St
- 53 Miller St
- 37 Rocky Gutter St
- 146 Miller St
- 28 Wareham St
- 167 Old Miller St
- 27 Ridge Dr
- 27 Ridge Dr Unit 27
- 124 Ashley Ln Unit 12-4
- 7 Tispaquin St
- 162 E Grove St
- 295 Cherry St
- 135 E Grove St
- 129 Thomas St
- 95 Cherry St
- 57 Long Point Rd Unit 208
Your Personal Tour Guide
Ask me questions while you tour the home.