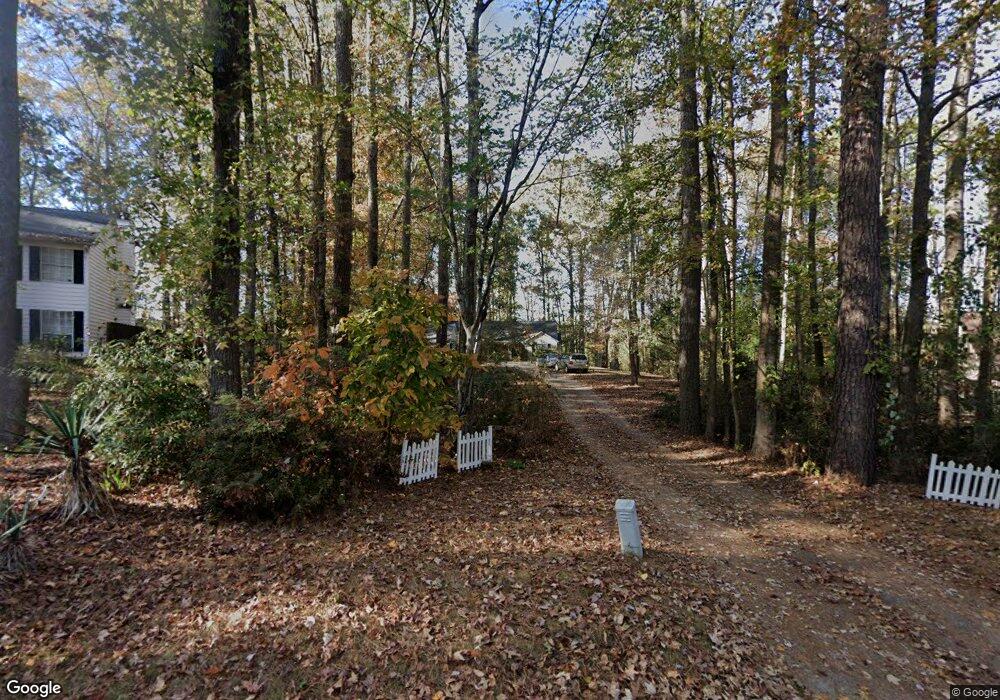
40 Spring Forest Way Sharpsburg, GA 30277
Estimated Value: $356,581 - $446,000
3
Beds
2
Baths
1,982
Sq Ft
$197/Sq Ft
Est. Value
About This Home
This home is located at 40 Spring Forest Way, Sharpsburg, GA 30277 and is currently estimated at $389,645, approximately $196 per square foot. 40 Spring Forest Way is a home located in Coweta County with nearby schools including Thomas Crossroads Elementary School, Lee Middle School, and Northgate High School.
Ownership History
Date
Name
Owned For
Owner Type
Purchase Details
Closed on
Aug 18, 2003
Sold by
Cook Kelly M
Bought by
Cook Kelly M and Cook Dana
Current Estimated Value
Purchase Details
Closed on
May 30, 1997
Sold by
Barber Harry P and Barber Hazel V
Bought by
Cook Kelly H
Home Financials for this Owner
Home Financials are based on the most recent Mortgage that was taken out on this home.
Original Mortgage
$106,000
Interest Rate
8.13%
Mortgage Type
New Conventional
Purchase Details
Closed on
Jun 21, 1991
Bought by
Barber Harry P and Barber Haz
Purchase Details
Closed on
Apr 11, 1991
Bought by
Haun Robert K
Purchase Details
Closed on
Jul 31, 1988
Bought by
Landward Ii Inc
Create a Home Valuation Report for This Property
The Home Valuation Report is an in-depth analysis detailing your home's value as well as a comparison with similar homes in the area
Home Values in the Area
Average Home Value in this Area
Purchase History
| Date | Buyer | Sale Price | Title Company |
|---|---|---|---|
| Cook Kelly M | -- | -- | |
| Cook Kelly H | $132,600 | -- | |
| Barber Harry P | $104,000 | -- | |
| Haun Robert K | $17,500 | -- | |
| Landward Ii Inc | -- | -- |
Source: Public Records
Mortgage History
| Date | Status | Borrower | Loan Amount |
|---|---|---|---|
| Previous Owner | Cook Kelly H | $106,000 |
Source: Public Records
Tax History Compared to Growth
Tax History
| Year | Tax Paid | Tax Assessment Tax Assessment Total Assessment is a certain percentage of the fair market value that is determined by local assessors to be the total taxable value of land and additions on the property. | Land | Improvement |
|---|---|---|---|---|
| 2025 | $3,059 | $134,315 | $28,000 | $106,315 |
| 2024 | $3,097 | $137,996 | $28,000 | $109,996 |
| 2023 | $3,097 | $132,440 | $28,000 | $104,440 |
| 2022 | $2,471 | $104,989 | $18,000 | $86,989 |
| 2021 | $2,197 | $88,124 | $18,000 | $70,124 |
| 2020 | $2,210 | $88,124 | $18,000 | $70,124 |
| 2019 | $1,914 | $70,206 | $10,000 | $60,206 |
| 2018 | $1,918 | $70,206 | $10,000 | $60,206 |
| 2017 | $1,918 | $70,206 | $10,000 | $60,206 |
| 2016 | $1,618 | $60,593 | $10,000 | $50,593 |
| 2015 | $1,522 | $58,064 | $10,000 | $48,064 |
| 2014 | $1,369 | $58,064 | $10,000 | $48,064 |
Source: Public Records
Map
Nearby Homes
- Spring Forest Way Lot: 2-1
- 3771 Highway 34 E Unit TRACT2
- 3771 Highway 34 E Unit TRACT1
- 0 Spring Forest Way Unit LOT 2-1 10483749
- 185 Grand Jct
- 20 Platinum Ridge
- 90 Spring Forest Trail
- 165 Bartlett Dr
- 160 Maple Leaf Rd
- 5 Timber Walk Place
- 160 Old Field Rd
- 85 Holly Springs Rd
- 150 Park Timbers Dr
- 0 Pinegate Way Unit 10436279
- 30 Creekwood Dr
- 2462 Sharpsburg McCullum Rd
- 435 Mapledale Trail
- 151 Brookstone Park
- 374 Beaumont Farms Dr
- 7 Barrington Ct
- 50 Spring Forest Way
- 20 Spring Forest Way
- 45 Spring Forest Way
- 0 Francis Way Unit 7 7052293
- 0 Francis Way Unit 7 7052268
- 0 Francis Pl Hwy 34 Unit 3058282
- 0 Francis Pl Hwy 34 Unit LOT 6 3058279
- 0 Francis Pl Hwy 34 Unit LOT 5 3058275
- 0 Francis Pl Hwy 34 Unit LOT 4 3058274
- 0 Francis Pl Hwy 34 Unit LOT 3 3058273
- 0 Francis Pl Hwy 34 Unit LOT 2 3058270
- 0 Francis Pl Hwy 34 Unit LOT 1 3058268
- 60 Spring Forest Way
- 15 Spring Forest Way
- 70 Spring Forest Way
- 75 Spring Forest Way
- 3446 Highway 34 E Unit 1AC
- 80 Spring Forest Way
- 0 Spring Forest
- 190 Spring Forest Way