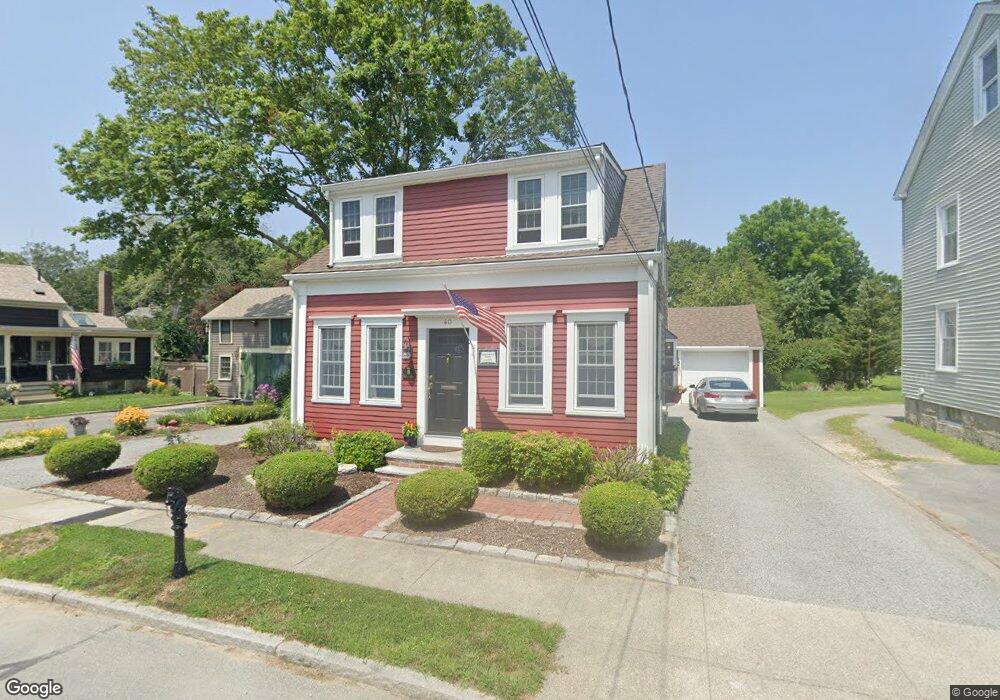
40 Spring St Fairhaven, MA 02719
Estimated Value: $439,000 - $465,696
4
Beds
2
Baths
1,230
Sq Ft
$367/Sq Ft
Est. Value
About This Home
This home is located at 40 Spring St, Fairhaven, MA 02719 and is currently estimated at $451,174, approximately $366 per square foot. 40 Spring St is a home located in Bristol County with nearby schools including Fairhaven High School, City On A Hill Charter Public School New Bedford, and St. Joseph School.
Ownership History
Date
Name
Owned For
Owner Type
Purchase Details
Closed on
Jun 27, 2024
Sold by
Harrison David C and Harrison Margaret F
Bought by
C D
Current Estimated Value
Purchase Details
Closed on
May 1, 1997
Sold by
Oliveira Jonathan J and Oliveira Luis M
Bought by
Harrison David C and Kimble Margaret F
Home Financials for this Owner
Home Financials are based on the most recent Mortgage that was taken out on this home.
Original Mortgage
$96,984
Interest Rate
7.85%
Mortgage Type
Purchase Money Mortgage
Create a Home Valuation Report for This Property
The Home Valuation Report is an in-depth analysis detailing your home's value as well as a comparison with similar homes in the area
Home Values in the Area
Average Home Value in this Area
Purchase History
| Date | Buyer | Sale Price | Title Company |
|---|---|---|---|
| C D | -- | None Available | |
| C D | -- | None Available | |
| Harrison David C | $97,000 | -- | |
| Harrison David C | $97,000 | -- |
Source: Public Records
Mortgage History
| Date | Status | Borrower | Loan Amount |
|---|---|---|---|
| Previous Owner | Harrison David C | $81,000 | |
| Previous Owner | Harrison David C | $88,000 | |
| Previous Owner | Harrison David C | $96,984 |
Source: Public Records
Tax History Compared to Growth
Tax History
| Year | Tax Paid | Tax Assessment Tax Assessment Total Assessment is a certain percentage of the fair market value that is determined by local assessors to be the total taxable value of land and additions on the property. | Land | Improvement |
|---|---|---|---|---|
| 2025 | $35 | $374,400 | $170,600 | $203,800 |
| 2024 | $3,358 | $363,800 | $170,600 | $193,200 |
| 2023 | $3,291 | $330,800 | $149,500 | $181,300 |
| 2022 | $3,195 | $312,600 | $138,900 | $173,700 |
| 2021 | $3,078 | $272,600 | $125,700 | $146,900 |
| 2020 | $3,015 | $272,600 | $125,700 | $146,900 |
| 2019 | $3,706 | $239,400 | $104,200 | $135,200 |
| 2018 | $3,534 | $228,300 | $99,200 | $129,100 |
| 2017 | $2,648 | $219,900 | $99,200 | $120,700 |
| 2016 | $2,553 | $209,600 | $99,200 | $110,400 |
| 2015 | $2,524 | $207,700 | $99,200 | $108,500 |
Source: Public Records
Map
Nearby Homes