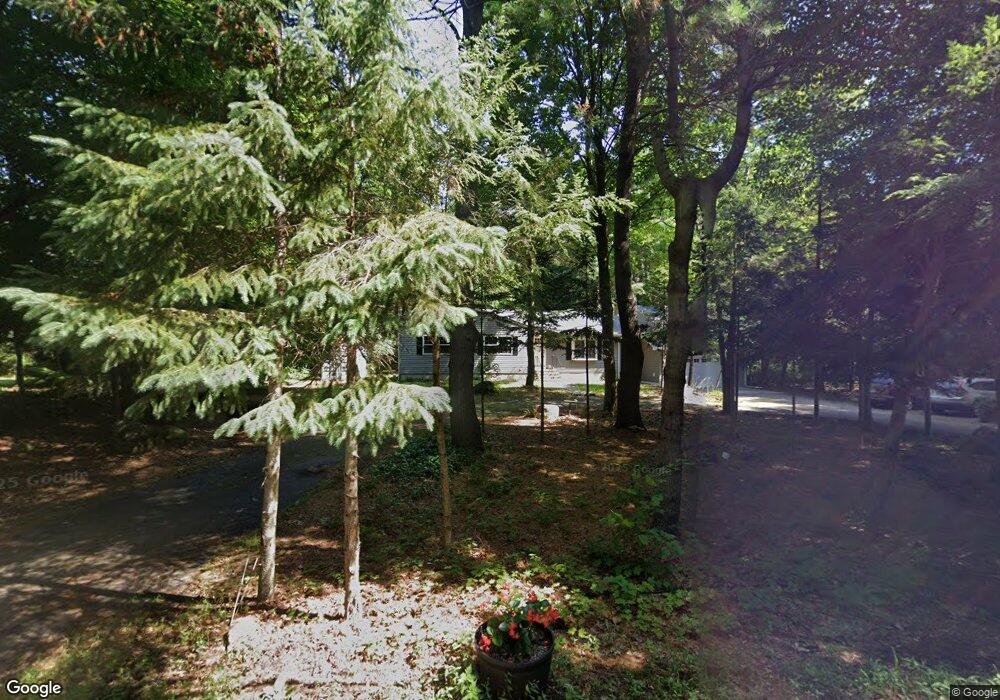
40 Spring St Foxboro, MA 02035
Estimated Value: $587,000 - $687,000
4
Beds
2
Baths
1,636
Sq Ft
$392/Sq Ft
Est. Value
About This Home
This home is located at 40 Spring St, Foxboro, MA 02035 and is currently estimated at $641,927, approximately $392 per square foot. 40 Spring St is a home located in Norfolk County with nearby schools including Foxborough High School, Foxborough Regional Charter School, and Hands-On-Montessori School.
Ownership History
Date
Name
Owned For
Owner Type
Purchase Details
Closed on
Apr 11, 1996
Sold by
Tremblay David R and Tremblay Susan N
Bought by
Roxborough Janet and Roxborough Joseph C
Current Estimated Value
Home Financials for this Owner
Home Financials are based on the most recent Mortgage that was taken out on this home.
Original Mortgage
$140,000
Outstanding Balance
$6,615
Interest Rate
7.39%
Mortgage Type
Purchase Money Mortgage
Estimated Equity
$635,312
Purchase Details
Closed on
Oct 29, 1993
Sold by
Baker Shiela I
Bought by
Tremblay David R and Tremblay Susan N
Home Financials for this Owner
Home Financials are based on the most recent Mortgage that was taken out on this home.
Original Mortgage
$138,400
Interest Rate
6.86%
Mortgage Type
Purchase Money Mortgage
Create a Home Valuation Report for This Property
The Home Valuation Report is an in-depth analysis detailing your home's value as well as a comparison with similar homes in the area
Home Values in the Area
Average Home Value in this Area
Purchase History
| Date | Buyer | Sale Price | Title Company |
|---|---|---|---|
| Roxborough Janet | $175,000 | -- | |
| Tremblay David R | $173,000 | -- |
Source: Public Records
Mortgage History
| Date | Status | Borrower | Loan Amount |
|---|---|---|---|
| Open | Roxborough Janet | $140,000 | |
| Previous Owner | Tremblay David R | $138,400 |
Source: Public Records
Tax History
| Year | Tax Paid | Tax Assessment Tax Assessment Total Assessment is a certain percentage of the fair market value that is determined by local assessors to be the total taxable value of land and additions on the property. | Land | Improvement |
|---|---|---|---|---|
| 2025 | $7,533 | $569,800 | $243,500 | $326,300 |
| 2024 | $5,477 | $405,400 | $261,100 | $144,300 |
| 2023 | $5,199 | $365,900 | $249,100 | $116,800 |
| 2022 | $5,081 | $349,900 | $223,400 | $126,500 |
| 2021 | $395 | $26,800 | $26,800 | $0 |
| 2020 | $390 | $26,800 | $26,800 | $0 |
| 2019 | $395 | $26,900 | $26,900 | $0 |
| 2018 | $384 | $25,800 | $25,800 | $0 |
| 2017 | $384 | $25,500 | $25,500 | $0 |
| 2016 | $368 | $24,800 | $24,800 | $0 |
| 2015 | $305 | $20,100 | $20,100 | $0 |
| 2014 | $301 | $20,100 | $20,100 | $0 |
Source: Public Records
Map
Nearby Homes
- 356 Central St
- 619 N Main St
- 233 Central St
- 25 Kingman Ave
- 166 Chauncy St
- 22 Pleasant St Unit B
- 157 Central St
- 81 Chilson Ave
- 266 N Main St Unit 3
- 150 Rumford Ave Unit 110
- 13 Summerville Rd Unit 13
- 122 Samoset Ave
- 28 Court St
- 46 Hope St
- 155 South St
- 44 Fairfield Park Unit 44
- 26 Fuller Rd Unit 6
- 97 East St
- 165 Chestnut St Unit 2
- 9 Independence Dr Unit 9
Your Personal Tour Guide
Ask me questions while you tour the home.